
This is Part 3 of a 3-part series. Part 1 tells the story of building this bot and what went wrong along the way. Part 2 is the step-by-step setup and full working code for the bot itself — read that first if you don’t have the base project running yet, since this post builds directly on top of it.
By the end of Part 2, the bot is trading and logging every trade and daily equity snapshot to CSV files. That’s fine if you’re comfortable reading raw CSVs over SSH, but it gets old fast. This post adds a proper dashboard: a self-updating web page showing your strategy’s performance against simple buy-and-hold, served over Apache on the same Linux box the bot is already running on.
What we’re building
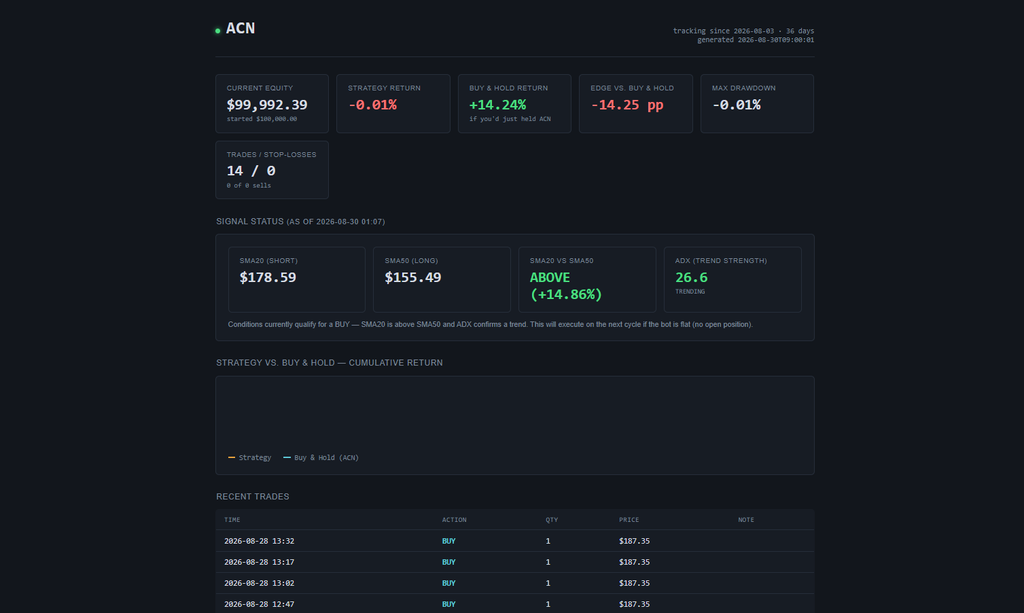
- A script that reads the bot’s log files and generates a single, self-contained HTML report — dark, terminal-style theme, an interactive chart, and a live “signal status” panel
- Apache configured to serve that file
- A cron job that regenerates the report automatically, so the page in your browser stays current without you doing anything
No server-side app, no database — Apache just serves whatever static HTML file was most recently generated. Simple to set up, simple to reason about, nothing to keep running besides the bot itself.
Prerequisites
- The bot from Part 2 already set up and running (or at least installed) in
~/alpaca_paper_bot - Apache2 installed on your Linux server (
sudo apt install apache2on Ubuntu/Debian if you don’t have it yet) matplotlibinstalled in your project’s virtual environment (used by the console report script, not the HTML one, but we’ll set both up)
Step 1: A console report script (optional but useful)
Before building the HTML version, here’s a simpler console-only report script — useful for a quick check over SSH without needing a browser at all:
"""
Reads equity_log_<SYMBOL>.csv and trade_log_<SYMBOL>.csv (written by
main.py while it runs) and prints a performance summary, plus saves an
equity-curve chart.

Run this anytime — it doesn't touch the live bot or the broker, just reads
the local log files main.py has been writing.

Usage:
    python report.py --symbol ACN
    python report.py --symbol SPY
"""
import argparse
import csv
import os
import sys

try:
    import matplotlib
    matplotlib.use("Agg")  # no display needed, just save to file
    import matplotlib.pyplot as plt
    HAS_MATPLOTLIB = True
except ImportError:
    HAS_MATPLOTLIB = False


def load_csv(path):
    if not os.path.isfile(path):
        return []
    with open(path, newline="") as f:
        return list(csv.DictReader(f))


def main():
    parser = argparse.ArgumentParser()
    parser.add_argument("--symbol", required=True,
                         help="Symbol to report on, e.g. ACN or SPY — must "
                              "match what main.py was run with")
    args = parser.parse_args()
    symbol = args.symbol.upper()

    equity_log_path = f"equity_log_{symbol}.csv"
    trade_log_path = f"trade_log_{symbol}.csv"
    chart_path = f"equity_curve_{symbol}.png"

    equity_rows = load_csv(equity_log_path)
    trade_rows = load_csv(trade_log_path)

    if not equity_rows:
        print(f"No data in {equity_log_path} yet — run main.py --symbol {symbol} "
              f"for at least one full day first (it snapshots equity once/day).")
        sys.exit(0)

    starting_equity = float(equity_rows[0]["equity"])
    current_equity = float(equity_rows[-1]["equity"])
    starting_price = float(equity_rows[0]["price"])
    current_price = float(equity_rows[-1]["price"])

    strategy_return_pct = (current_equity - starting_equity) / starting_equity * 100
    bh_return_pct = (current_price - starting_price) / starting_price * 100

    # Max drawdown across the equity curve so far
    peak = float(equity_rows[0]["equity"])
    max_drawdown_pct = 0.0
    for row in equity_rows:
        eq = float(row["equity"])
        peak = max(peak, eq)
        drawdown = (peak - eq) / peak * 100
        max_drawdown_pct = max(max_drawdown_pct, drawdown)

    print(f"\n--- Live Paper Trading Report: {symbol} ---")
    print(f"Tracking since:     {equity_rows[0]['timestamp']}")
    print(f"Days tracked:       {len(equity_rows)}")
    print(f"Starting equity:    ${starting_equity:,.2f}")
    print(f"Current equity:     ${current_equity:,.2f}")
    print(f"Strategy return:    {strategy_return_pct:+.2f}%")
    print(f"Buy & hold return:  {bh_return_pct:+.2f}% (if you'd just held {symbol} instead)")
    print(f"Strategy vs. B&H:   {strategy_return_pct - bh_return_pct:+.2f} percentage points")
    print(f"Max drawdown:       {max_drawdown_pct:.2f}%")

    trades = [r for r in trade_rows if r["action"] in ("BUY", "SELL")]
    sells = [r for r in trade_rows if r["action"] == "SELL"]
    stop_losses = [r for r in trade_rows if r.get("note") == "stop-loss"]
    print(f"\nTotal trades:       {len(trades)}")
    print(f"Stop-loss exits:    {len(stop_losses)} of {len(sells)} sells")

    if trade_rows:
        print(f"\nMost recent trades:")
        for row in trade_rows[-5:]:
            note = f" ({row['note']})" if row.get("note") else ""
            print(f"  {row['timestamp']}  {row['action']:5s}  "
                  f"{row['qty']} @ {float(row['price']):.2f}{note}")

    if HAS_MATPLOTLIB and len(equity_rows) > 1:
        dates = [row["timestamp"] for row in equity_rows]
        equities = [float(row["equity"]) for row in equity_rows]
        prices = [float(row["price"]) for row in equity_rows]

        # Normalize both to % return from day 1 so they're comparable on
        # one chart regardless of price scale vs. account size.
        equity_pct = [(e - starting_equity) / starting_equity * 100 for e in equities]
        price_pct = [(p - starting_price) / starting_price * 100 for p in prices]

        fig, ax = plt.subplots(figsize=(10, 5))
        ax.plot(range(len(dates)), equity_pct, label="Strategy (equity)", linewidth=2)
        ax.plot(range(len(dates)), price_pct, label=f"Buy & hold ({symbol})",
                 linewidth=2, linestyle="--")
        ax.axhline(0, color="gray", linewidth=0.8)
        ax.set_xlabel("Days tracked")
        ax.set_ylabel("Return (%)")
        ax.set_title(f"Live Paper Trading: Strategy vs. Buy & Hold ({symbol})")
        ax.legend()
        ax.grid(True, alpha=0.3)
        fig.tight_layout()
        fig.savefig(chart_path, dpi=120)
        print(f"\nChart saved to {chart_path}")
    elif not HAS_MATPLOTLIB:
        print(f"\n(Install matplotlib for a chart: pip install matplotlib)")


if __name__ == "__main__":
    main()
Save this as report.py in your project directory. Run it anytime:
python3 report.py --symbol ACN
It prints your total return, a buy-and-hold comparison, max drawdown, recent trades, and saves a matplotlib chart (equity_curve_ACN.png) you can pull off the server if you want a quick visual without setting up the full dashboard.
Step 2: The HTML dashboard generator
This is the main piece — a script that builds a complete, self-contained HTML report from your log files. It’s a long file because the HTML/CSS/JavaScript for the chart is embedded directly in the Python script as a template, which keeps the whole dashboard to a single generated file with no separate assets to manage.
"""
Generates a self-contained, static HTML report from equity_log_<SYMBOL>.csv
and trade_log_<SYMBOL>.csv — meant to be served by Apache (or any static
file server).
This script does NOT run a server itself. Run it whenever you want the
report to refresh (manually, or on a cron schedule — see README.md), and
it overwrites the output HTML file in place.
Usage:
python generate_html_report.py --symbol ACN --output web/ACN/index.html
python generate_html_report.py --symbol SPY --output web/SPY/index.html
"""
import argparse
import csv
import json
import os
from datetime import datetime
def load_csv(path):
if not os.path.isfile(path):
return []
with open(path, newline="") as f:
return list(csv.DictReader(f))
def build_report_data(symbol: str):
equity_rows = load_csv(f"equity_log_{symbol}.csv")
trade_rows = load_csv(f"trade_log_{symbol}.csv")
indicator_rows = load_csv(f"indicator_log_{symbol}.csv")
if not equity_rows:
return None
starting_equity = float(equity_rows[0]["equity"])
current_equity = float(equity_rows[-1]["equity"])
starting_price = float(equity_rows[0]["price"])
current_price = float(equity_rows[-1]["price"])
strategy_return_pct = (current_equity - starting_equity) / starting_equity * 100
bh_return_pct = (current_price - starting_price) / starting_price * 100
peak = starting_equity
max_drawdown_pct = 0.0
for row in equity_rows:
eq = float(row["equity"])
peak = max(peak, eq)
max_drawdown_pct = max(max_drawdown_pct, (peak - eq) / peak * 100)
dates = [row["timestamp"][:10] for row in equity_rows]
equity_pct = [round((float(r["equity"]) - starting_equity) / starting_equity * 100, 3)
for r in equity_rows]
price_pct = [round((float(r["price"]) - starting_price) / starting_price * 100, 3)
for r in equity_rows]
sells = [r for r in trade_rows if r["action"] == "SELL"]
stop_losses = [r for r in trade_rows if r.get("note") == "stop-loss"]
latest_indicator = indicator_rows[-1] if indicator_rows else None
return {
"symbol": symbol,
"generated_at": datetime.now().isoformat(timespec="seconds"),
"tracking_since": equity_rows[0]["timestamp"][:10],
"days_tracked": len(equity_rows),
"starting_equity": starting_equity,
"current_equity": current_equity,
"strategy_return_pct": round(strategy_return_pct, 2),
"bh_return_pct": round(bh_return_pct, 2),
"edge_pct": round(strategy_return_pct - bh_return_pct, 2),
"max_drawdown_pct": round(max_drawdown_pct, 2),
"total_trades": len([r for r in trade_rows if r["action"] in ("BUY", "SELL")]),
"stop_loss_count": len(stop_losses),
"sell_count": len(sells),
"dates": dates,
"equity_pct": equity_pct,
"price_pct": price_pct,
"trades": list(reversed(trade_rows[-15:])), # most recent first
"indicator": {
"timestamp": latest_indicator["timestamp"],
"sma_short": float(latest_indicator["sma_short"]),
"sma_long": float(latest_indicator["sma_long"]),
"adx": float(latest_indicator["adx"]),
"gap_pct": float(latest_indicator["gap_pct"]),
} if latest_indicator else None,
}
HTML_TEMPLATE = """<!DOCTYPE html>
<html lang="en">
<head>
<meta charset="UTF-8">
<meta name="viewport" content="width=device-width, initial-scale=1.0">
<title>{symbol} — Trading Bot Report</title>
<script src="https://cdnjs.cloudflare.com/ajax/libs/Chart.js/4.4.4/chart.umd.min.js"></script>
<style>
:root {{
--bg: #12161c;
--panel: #171c24;
--panel-border: #262e3a;
--text: #d7dce3;
--text-dim: #7c8798;
--amber: #e8a33d;
--cyan: #5ec8d8;
--green: #4ade80;
--red: #f87171;
--mono: 'IBM Plex Mono', 'SFMono-Regular', Consolas, monospace;
--sans: 'Inter', -apple-system, BlinkMacSystemFont, sans-serif;
}}
* {{ box-sizing: border-box; }}
body {{
margin: 0;
background: var(--bg);
color: var(--text);
font-family: var(--sans);
padding: 32px 24px 64px;
}}
.wrap {{ max-width: 980px; margin: 0 auto; }}
header {{
display: flex;
align-items: baseline;
justify-content: space-between;
flex-wrap: wrap;
gap: 8px;
border-bottom: 1px solid var(--panel-border);
padding-bottom: 20px;
margin-bottom: 28px;
}}
.ticker {{
font-family: var(--mono);
font-size: 28px;
font-weight: 600;
letter-spacing: 0.5px;
color: var(--text);
}}
.ticker .dot {{
display: inline-block;
width: 8px; height: 8px;
border-radius: 50%;
background: var(--green);
margin-right: 10px;
box-shadow: 0 0 8px var(--green);
}}
.meta {{
font-family: var(--mono);
font-size: 12px;
color: var(--text-dim);
text-align: right;
}}
.stats {{
display: grid;
grid-template-columns: repeat(auto-fit, minmax(180px, 1fr));
gap: 12px;
margin-bottom: 28px;
}}
.stat {{
background: var(--panel);
border: 1px solid var(--panel-border);
border-radius: 6px;
padding: 16px 18px;
}}
.stat .label {{
font-size: 11px;
text-transform: uppercase;
letter-spacing: 0.8px;
color: var(--text-dim);
margin-bottom: 6px;
}}
.stat .value {{
font-family: var(--mono);
font-size: 24px;
font-weight: 600;
}}
.stat .sub {{
font-family: var(--mono);
font-size: 11px;
color: var(--text-dim);
margin-top: 4px;
}}
.pos {{ color: var(--green); }}
.neg {{ color: var(--red); }}
.panel-title {{
font-size: 13px;
text-transform: uppercase;
letter-spacing: 0.8px;
color: var(--text-dim);
margin: 0 0 14px 2px;
}}
.chart-panel {{
background: var(--panel);
border: 1px solid var(--panel-border);
border-radius: 6px;
padding: 20px;
margin-bottom: 28px;
}}
.legend {{
display: flex;
gap: 20px;
font-family: var(--mono);
font-size: 12px;
color: var(--text-dim);
margin-top: 12px;
}}
.legend span {{ display: flex; align-items: center; gap: 6px; }}
.swatch {{ width: 12px; height: 2px; display: inline-block; }}
table {{
width: 100%;
border-collapse: collapse;
font-family: var(--mono);
font-size: 13px;
background: var(--panel);
border: 1px solid var(--panel-border);
border-radius: 6px;
overflow: hidden;
}}
th {{
text-align: left;
font-size: 11px;
text-transform: uppercase;
letter-spacing: 0.6px;
color: var(--text-dim);
padding: 10px 14px;
border-bottom: 1px solid var(--panel-border);
font-weight: 500;
}}
td {{
padding: 9px 14px;
border-bottom: 1px solid var(--panel-border);
color: var(--text);
}}
tr:last-child td {{ border-bottom: none; }}
.action-buy {{ color: var(--cyan); font-weight: 600; }}
.action-sell {{ color: var(--amber); font-weight: 600; }}
.action-sell.stoploss {{ color: var(--red); }}
.note {{ color: var(--text-dim); font-size: 12px; }}
.empty {{
text-align: center;
color: var(--text-dim);
padding: 80px 20px;
font-family: var(--mono);
}}
footer {{
margin-top: 28px;
font-family: var(--mono);
font-size: 11px;
color: var(--text-dim);
text-align: center;
}}
</style>
</head>
<body>
<div class="wrap">
{body}
</div>
</body>
</html>
"""
def render_stat(label, value, sub=None, colored=None):
cls = ""
if colored is not None:
cls = "pos" if colored >= 0 else "neg"
sub_html = f'<div class="sub">{sub}</div>' if sub else ""
return f"""<div class="stat">
<div class="label">{label}</div>
<div class="value {cls}">{value}</div>
{sub_html}
</div>"""
def render_trade_row(row):
action = row["action"]
note = row.get("note", "")
is_stoploss = note == "stop-loss"
action_cls = "action-buy" if action == "BUY" else "action-sell"
if is_stoploss:
action_cls += " stoploss"
note_html = f'<span class="note">{note}</span>' if note else ""
price = float(row["price"])
return f"""<tr>
<td>{row['timestamp'][:16].replace('T',' ')}</td>
<td class="{action_cls}">{action}</td>
<td>{row['qty']}</td>
<td>${price:,.2f}</td>
<td>{note_html}</td>
</tr>"""
def render_indicator_panel(indicator):
if indicator is None:
return """<div class="panel-title">Signal Status</div>
<div class="chart-panel">
<div class="note" style="padding: 8px 0;">
No indicator data yet — this appears once main.py has run for
at least one full day.
</div>
</div>"""
above = indicator["sma_short"] > indicator["sma_long"]
cross_label = "ABOVE" if above else "BELOW"
trending = indicator["adx"] >= 25
adx_label = "TRENDING" if trending else "NOT TRENDING"
gap_sign = "+" if indicator["gap_pct"] >= 0 else ""
stats_html = "".join([
render_stat("SMA20 (short)", f"${indicator['sma_short']:,.2f}"),
render_stat("SMA50 (long)", f"${indicator['sma_long']:,.2f}"),
render_stat("SMA20 vs SMA50", f"{cross_label} ({gap_sign}{indicator['gap_pct']:.2f}%)",
colored=(1 if above else -1)),
render_stat("ADX (trend strength)", f"{indicator['adx']:.1f}",
sub=adx_label, colored=(1 if trending else -1)),
])
signal_ready = above and trending
readiness = ('Conditions currently qualify for a BUY — SMA20 is above '
'SMA50 and ADX confirms a trend. This will execute on the '
'next cycle if the bot is flat (no open position).'
if signal_ready else
'Needs SMA20 above SMA50 AND ADX ≥ 25 at the same time '
'for a BUY to fire.')
return f"""<div class="panel-title">Signal Status <span class="note">(as of {indicator['timestamp'][:16].replace('T',' ')})</span></div>
<div class="chart-panel">
<div class="stats" style="margin-bottom: 12px;">{stats_html}</div>
<div class="note">{readiness}</div>
</div>"""
def render_body(data):
if data is None:
return """<div class="empty">
No data yet. This page will populate once main.py has been
running for at least one full day (it snapshots equity once/day).
</div>"""
edge_sign = "+" if data["edge_pct"] >= 0 else ""
strat_sign = "+" if data["strategy_return_pct"] >= 0 else ""
bh_sign = "+" if data["bh_return_pct"] >= 0 else ""
stats_html = "".join([
render_stat("Current Equity", f"${data['current_equity']:,.2f}",
sub=f"started ${data['starting_equity']:,.2f}"),
render_stat("Strategy Return", f"{strat_sign}{data['strategy_return_pct']}%",
colored=data["strategy_return_pct"]),
render_stat("Buy & Hold Return", f"{bh_sign}{data['bh_return_pct']}%",
colored=data["bh_return_pct"],
sub=f"if you'd just held {data['symbol']}"),
render_stat("Edge vs. Buy & Hold", f"{edge_sign}{data['edge_pct']} pp",
colored=data["edge_pct"]),
render_stat("Max Drawdown", f"-{data['max_drawdown_pct']}%"),
render_stat("Trades / Stop-losses", f"{data['total_trades']} / {data['stop_loss_count']}",
sub=f"{data['stop_loss_count']} of {data['sell_count']} sells"),
])
trade_rows_html = "".join(render_trade_row(r) for r in data["trades"]) or \
'<tr><td colspan="5" class="note">No trades yet.</td></tr>'
chart_data_json = json.dumps({
"dates": data["dates"],
"equity_pct": data["equity_pct"],
"price_pct": data["price_pct"],
})
return f"""
<header>
<div class="ticker"><span class="dot"></span>{data['symbol']}</div>
<div class="meta">
tracking since {data['tracking_since']} · {data['days_tracked']} days<br>
generated {data['generated_at']}
</div>
</header>
<div class="stats">{stats_html}</div>
{render_indicator_panel(data.get("indicator"))}
<div class="panel-title">Strategy vs. Buy & Hold — Cumulative Return</div>
<div class="chart-panel">
<canvas id="equityChart" height="90"></canvas>
<div class="legend">
<span><span class="swatch" style="background:var(--amber)"></span>Strategy</span>
<span><span class="swatch" style="background:var(--cyan)"></span>Buy & Hold ({data['symbol']})</span>
</div>
</div>
<div class="panel-title">Recent Trades</div>
<table>
<thead><tr><th>Time</th><th>Action</th><th>Qty</th><th>Price</th><th>Note</th></tr></thead>
<tbody>{trade_rows_html}</tbody>
</table>
<footer>generated by generate_html_report.py · refresh this page or re-run the script for updated data</footer>
<script>
const data = {chart_data_json};
const ctx = document.getElementById('equityChart').getContext('2d');
// Fill the gap between the two lines so the strategy's edge (or
// deficit) vs. buy-and-hold is visible at a glance, not just inferred
// from two overlapping lines.
const edgeFill = {{
id: 'edgeFill',
beforeDatasetsDraw(chart) {{
const {{ ctx, chartArea: {{ left, right }}, scales: {{ x, y }} }} = chart;
const strat = chart.data.datasets[0].data;
const bh = chart.data.datasets[1].data;
ctx.save();
for (let i = 0; i < strat.length - 1; i++) {{
const ahead = strat[i] >= bh[i];
ctx.fillStyle = ahead ? 'rgba(74, 222, 128, 0.10)' : 'rgba(248, 113, 113, 0.10)';
ctx.beginPath();
ctx.moveTo(x.getPixelForValue(i), y.getPixelForValue(strat[i]));
ctx.lineTo(x.getPixelForValue(i + 1), y.getPixelForValue(strat[i + 1]));
ctx.lineTo(x.getPixelForValue(i + 1), y.getPixelForValue(bh[i + 1]));
ctx.lineTo(x.getPixelForValue(i), y.getPixelForValue(bh[i]));
ctx.closePath();
ctx.fill();
}}
ctx.restore();
}}
}};
new Chart(ctx, {{
type: 'line',
data: {{
labels: data.dates,
datasets: [
{{
label: 'Strategy',
data: data.equity_pct,
borderColor: '#e8a33d',
backgroundColor: 'transparent',
borderWidth: 2,
pointRadius: 0,
tension: 0.15,
}},
{{
label: 'Buy & Hold',
data: data.price_pct,
borderColor: '#5ec8d8',
backgroundColor: 'transparent',
borderWidth: 2,
borderDash: [4, 3],
pointRadius: 0,
tension: 0.15,
}},
],
}},
options: {{
responsive: true,
interaction: {{ mode: 'index', intersect: false }},
plugins: {{
legend: {{ display: false }},
tooltip: {{
backgroundColor: '#171c24',
borderColor: '#262e3a',
borderWidth: 1,
titleFont: {{ family: 'IBM Plex Mono' }},
bodyFont: {{ family: 'IBM Plex Mono' }},
callbacks: {{
label: (item) => `${{item.dataset.label}}: ${{item.parsed.y.toFixed(2)}}%`
}}
}},
}},
scales: {{
x: {{
grid: {{ color: '#1d232c' }},
ticks: {{ color: '#7c8798', font: {{ family: 'IBM Plex Mono', size: 10 }}, maxRotation: 0 }},
}},
y: {{
grid: {{ color: '#1d232c' }},
ticks: {{
color: '#7c8798',
font: {{ family: 'IBM Plex Mono', size: 10 }},
callback: (v) => v + '%'
}},
}},
}},
}},
plugins: [edgeFill],
}});
</script>
"""
def main():
parser = argparse.ArgumentParser()
parser.add_argument("--symbol", required=True,
help="Symbol to report on, e.g. ACN or SPY — must "
"match what main.py was run with")
parser.add_argument("--output", default=None,
help="Path to write the HTML file "
"(default: web/<SYMBOL>/index.html)")
args = parser.parse_args()
symbol = args.symbol.upper()
output = args.output or f"web/{symbol}/index.html"
data = build_report_data(symbol)
body = render_body(data)
html = HTML_TEMPLATE.format(symbol=symbol if data else "—", body=body)
os.makedirs(os.path.dirname(output) or ".", exist_ok=True)
with open(output, "w") as f:
f.write(html)
print(f"Report written to {output}")
if __name__ == "__main__":
main()
Save this as generate_html_report.py. A few things worth understanding about what it does:
- It reads three log files per symbol:
equity_log_<SYMBOL>.csv,trade_log_<SYMBOL>.csv, andindicator_log_<SYMBOL>.csv(all written automatically bymain.pyfrom Part 2). - The chart shades the gap between your strategy’s return and buy-and-hold’s return — green when you’re ahead, red when you’re behind — so the strategy’s edge (or lack of it) is visible at a glance instead of something you have to infer from two overlapping lines.
- The “Signal Status” panel shows the current SMA20/SMA50/ADX values directly on the page, so you can see how close the strategy is to its next trade without needing to SSH in and watch console output.
- It’s read-only — this script never touches the broker or the running bot, it only reads local CSV files. Safe to run as often as you like.
Generate your first report:
python3 generate_html_report.py --symbol ACN --output web/ACN/index.html
This creates a web/ACN/index.html file inside your project directory. Open it locally first (copy it to your own machine, or just cat it) to confirm it looks right before wiring up Apache.
Step 3: Point Apache at the report
The simplest approach is an Apache Alias, which maps a URL path directly to your project’s web/ folder without needing to copy files into /var/www/html or mess with permissions there.
Create a new Apache config file:
sudo tee /etc/apache2/conf-available/tradingbot.conf > /dev/null << 'CONF'
Alias /tradingbot /home/YOUR_USERNAME/alpaca_paper_bot/web
<Directory /home/YOUR_USERNAME/alpaca_paper_bot/web>
    Require all granted
</Directory>
CONF
Replace YOUR_USERNAME with your actual Linux username. Then enable the config and reload Apache:
sudo a2enconf tradingbot
sudo systemctl reload apache2
Visit http://your-server-ip/tradingbot/ACN/ in a browser — you should see the dashboard.
If you get a 403 Forbidden error
This is the most common snag, and it’s almost always permissions. Apache runs as the www-data user, and it needs traversal permission on every directory in the path to your file — not just the final folder. Home directories are often locked down by default, which blocks www-data even though the Apache config itself is correct.
Check the whole permission chain:
ls -l /home/YOUR_USERNAME/alpaca_paper_bot/web/ACN/index.html
If any directory in that list is missing execute (x) permission for “others,” grant just enough to allow traversal — not full access:
chmod o+x /home/YOUR_USERNAME
chmod o+x /home/YOUR_USERNAME/alpaca_paper_bot
chmod o+x /home/YOUR_USERNAME/alpaca_paper_bot/web
This only allows Apache to pass through those directories to reach the specific file — it doesn’t let it list or read anything else inside them.
Step 4: Keep the report fresh with cron
Right now the dashboard only shows whatever was true the moment you ran the generator script. Set up a cron job to regenerate it automatically:
crontab -e
Add a line to regenerate the report every 15 minutes (matching the bot’s default polling interval):
*/15 * * * * cd /home/YOUR_USERNAME/alpaca_paper_bot && venv/bin/python generate_html_report.py --symbol ACN --output web/ACN/index.html
Two details that matter here:
- Use the full path to your venv’s Python (
venv/bin/python), not justpython. Cron runs with a minimal environment and doesn’t activate your virtualenv automatically — using the venv’s own interpreter directly sidesteps that entirely. cdinto the project directory first. The script reads log files using relative paths (equity_log_ACN.csv, etc.), so it needs to actually be running from inside the project folder to find them.
Step 5: Running more than one symbol
If you’re paper-trading multiple symbols (see Part 2 for running two main.py instances at once), generate a report per symbol into its own subfolder:
python3 generate_html_report.py --symbol ACN --output web/ACN/index.html
python3 generate_html_report.py --symbol SPY --output web/SPY/index.html
With the Apache Alias from Step 3, these become reachable at /tradingbot/ACN/ and /tradingbot/SPY/ respectively. Add a second cron line for the second symbol, same pattern as Step 4.
A note on security
This setup has no authentication — anyone who can reach the URL can see your (paper) trading performance. That’s a reasonable trade-off on a private home network, but not something to expose directly to the public internet. If you need external access, put it behind a reverse proxy with basic auth, or at minimum restrict by IP address directly in the Apache config:
<Directory /home/YOUR_USERNAME/alpaca_paper_bot/web>
    Require ip 203.0.113.0/24
</Directory>
Replace the example IP range with whatever network you actually trust.
Wrapping up the series
That’s the full build: a modular trading bot with a tested strategy and real risk management (Part 2), built on the lessons from actually running it and hitting real bugs (Part 1), now with a live dashboard to watch it work (this post). The whole project — bot, backtester, and dashboard — is maybe 1,500 lines of Python, and every part of it earned its place by something that broke during actual use, not by anticipating problems in advance. That’s probably the biggest lesson of the whole series: build the smallest version that works, run it for real, and let what actually breaks tell you what to build next.