
Affiliate Disclosure: This post contains Amazon affiliate links. If you purchase a product through one of these links, I may earn a small commission at no additional cost to you. I only recommend products that I have personally used or believe are worth considering.
My server rack doesn’t have a cooling solution like a data centre does. That isn’t practical in a home lab, but I still need to be conscious of temperature. Summers in England can bring scorching heat and winters can get very cold, and I want to be alerted when something is wrong before my servers crash. I also want to keep an eye on the power the rack uses, especially with electricity costing what it does now.
I’ve used Check_MK to monitor my lab for years, and it’s already set up to email me alerts. So rather than build a separate system, this project feeds temperature, humidity and power readings from a Raspberry Pi into Check_MK, where I can set warning and critical thresholds like any other service.
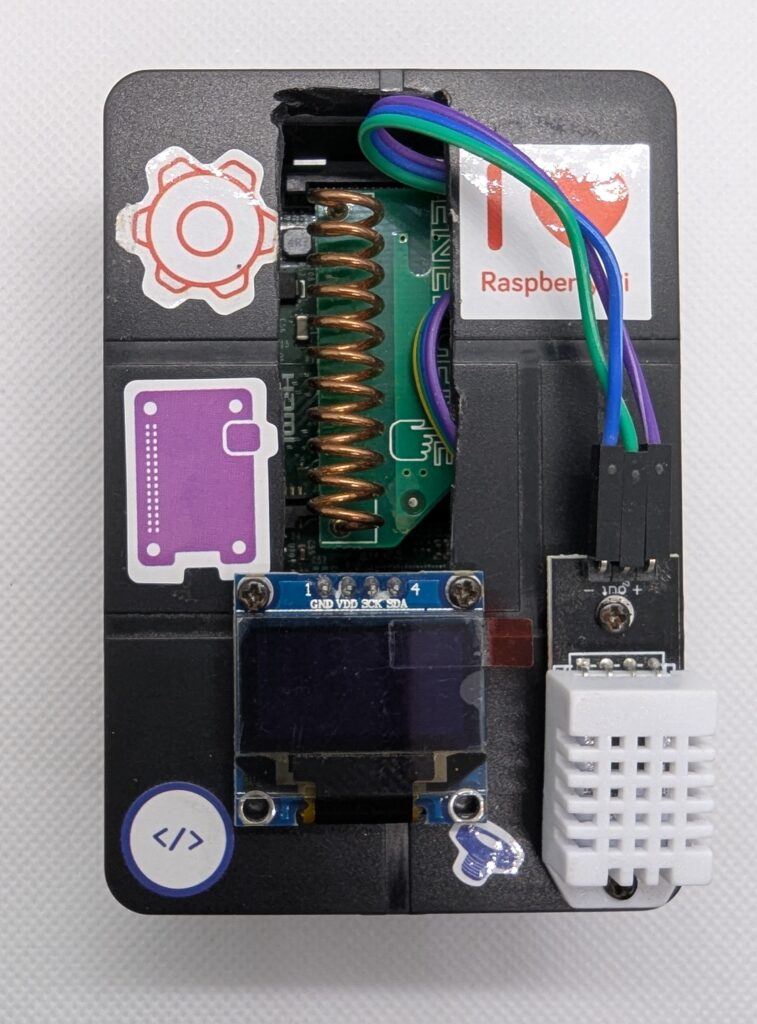
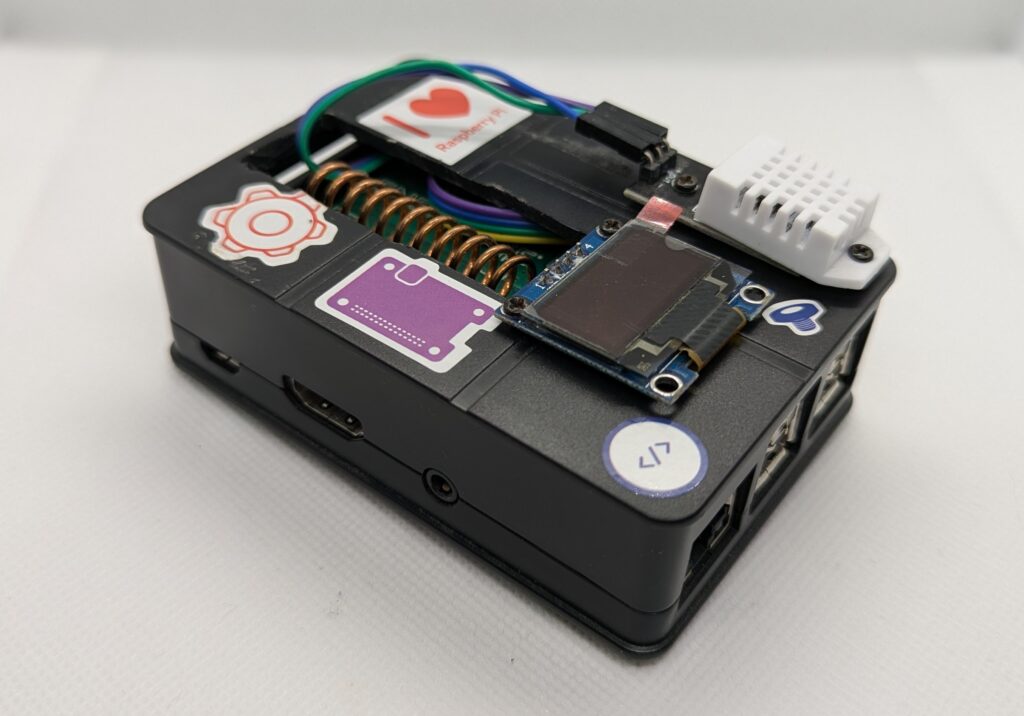
By the end you’ll have:
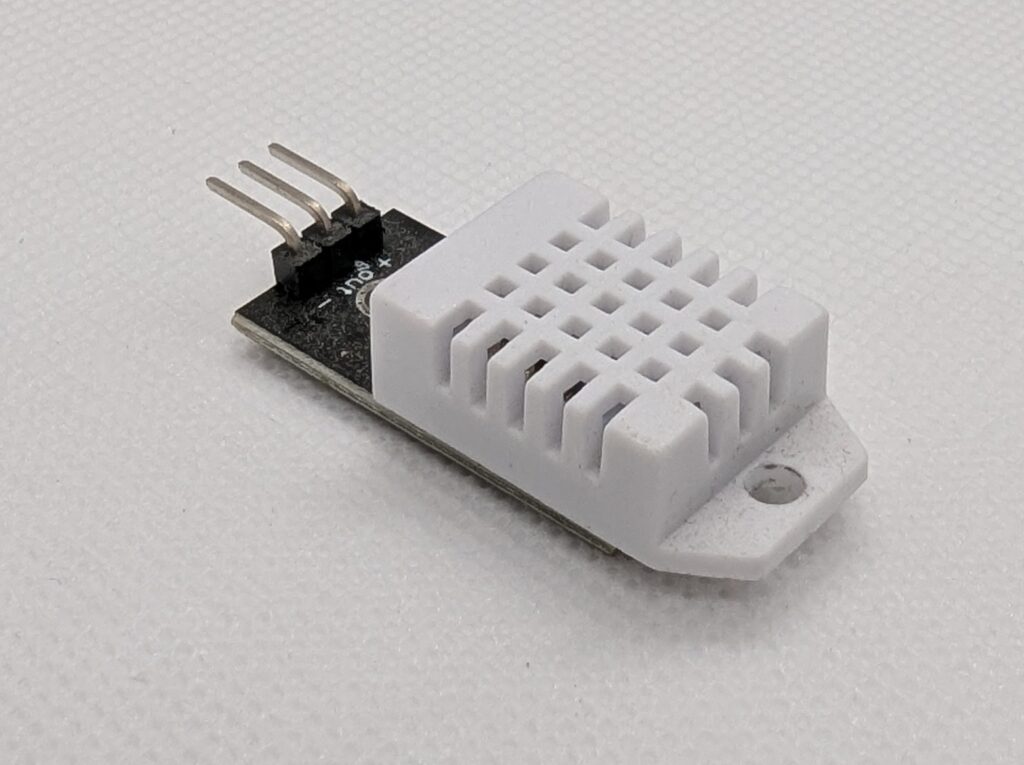
- Rack temperature and humidity from a DHT22 sensor
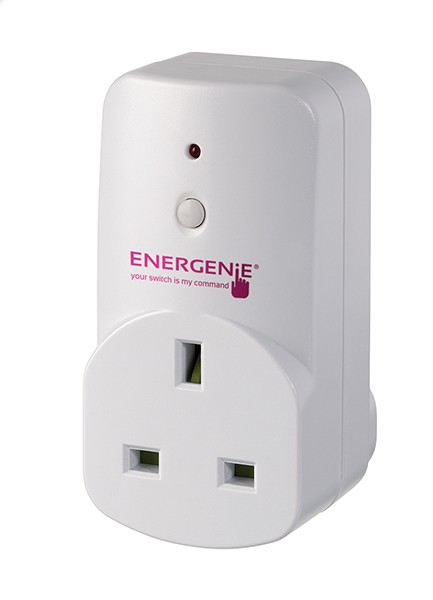
- Rack power draw in watts from an Energenie Mi|Home Monitor adapter, with a running cost estimate based on your tariff
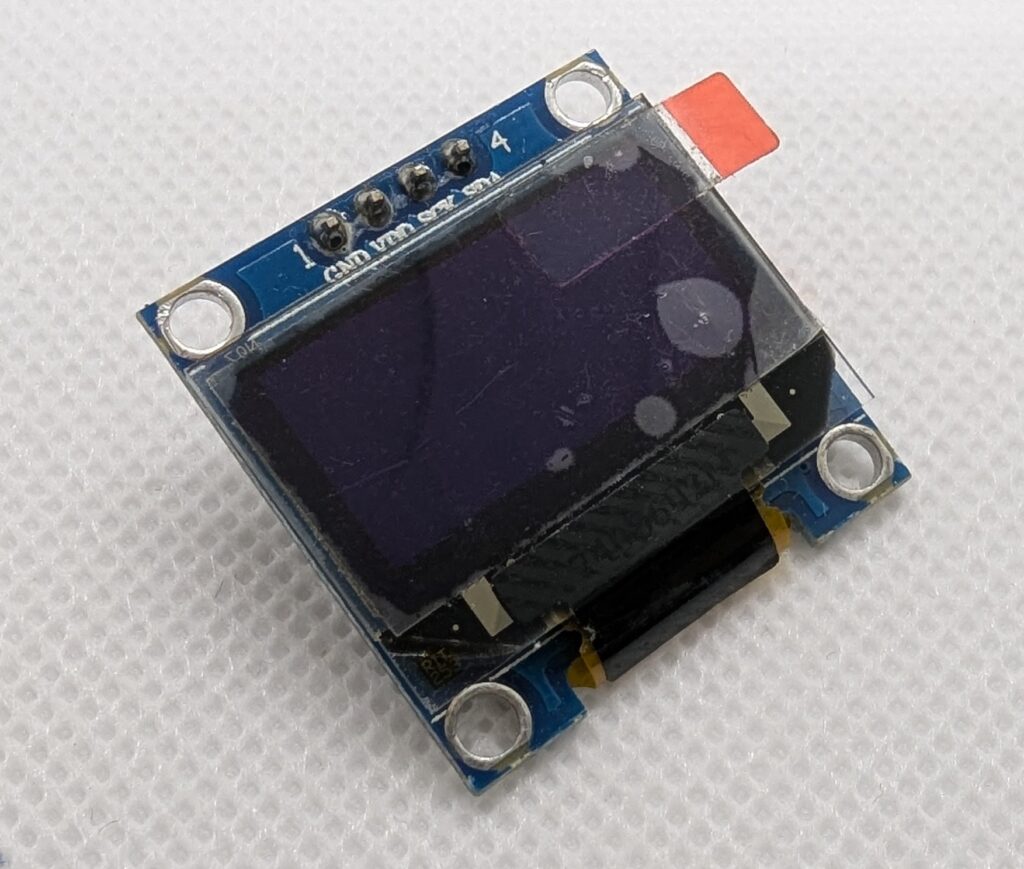
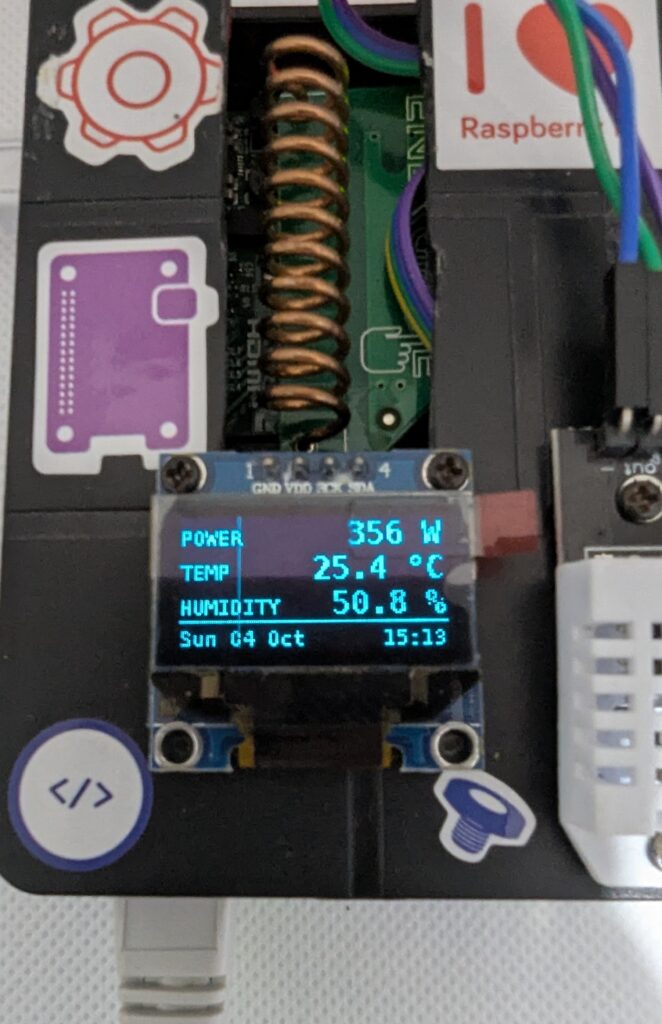
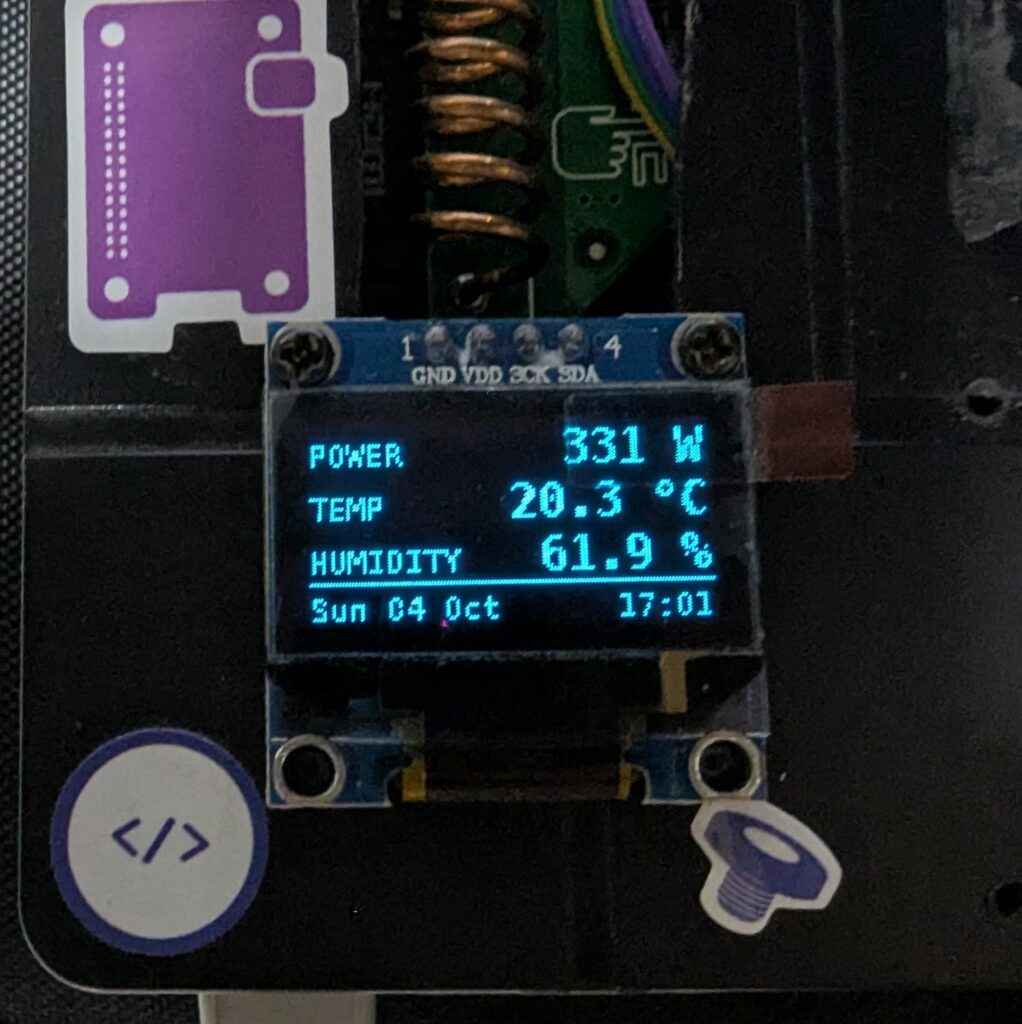
- A small OLED display showing the live values
- Check_MK services with warning and critical alerts, including an alert if the data stops updating
- Everything running as systemd services that start on boot and restart themselves if they fail
Parts list
The links in this list are Amazon affiliate links (see the disclosure at the top of the article).
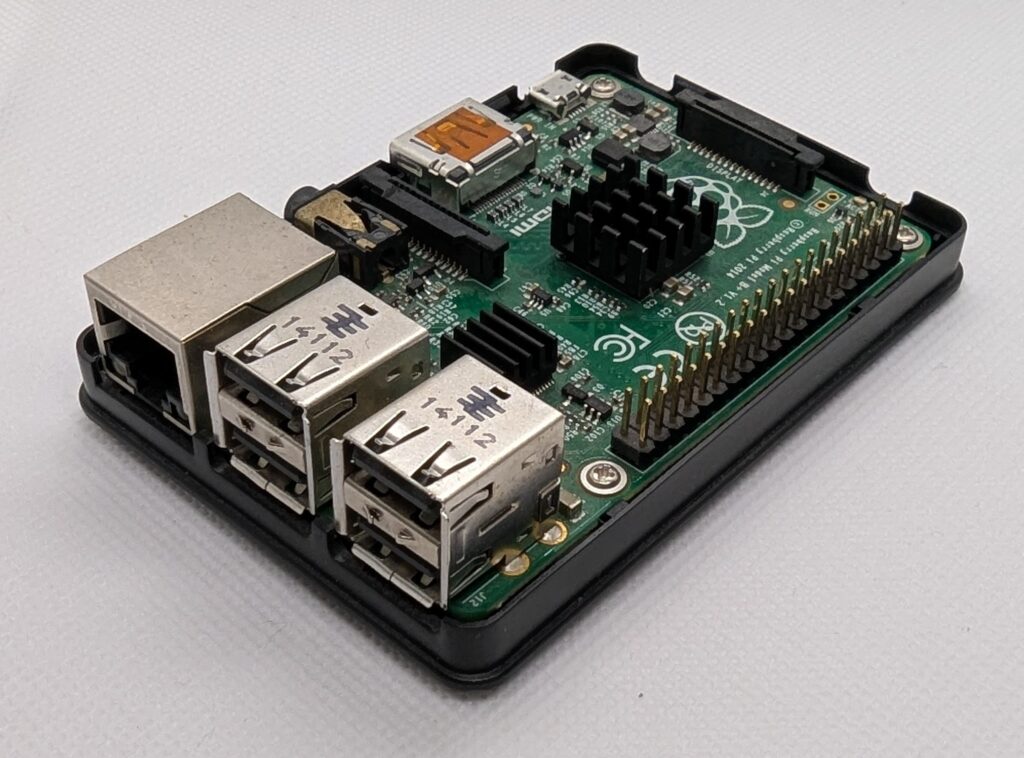
- Raspberry Pi 2 or newer. A Pi 3 is preferable and a Pi 4 is overkill. I’m using a Pi 2 because it was lying around.
- DHT22 temperature and humidity sensor
- Energenie two-way Pi-mote (the radio board that plugs onto the Pi)
- Energenie Mi|Home Monitor plug-in adapter (measures the power; the rack plugs into it)
- 0.96 inch I2C OLED display module, 128×64
- A longer cable for the DHT22 (see “Sensor placement” below)
- A soldering iron, solder and some hook-up wire (the DHT22 and the display are soldered to the Pi-mote, see “Building the unit”)
- A case for the Pi, with a lid you can cut a slot in for the Pi-mote’s antenna, and a rotary tool such as a Dremel to cut it (I used a Dremel)
- A working Check_MK server. I’m using Checkmk 2.1.0p49. The server-side plugin in this article uses Check API version 1, which Checkmk supports from 2.0 to 2.3. Checkmk 2.4 and later no longer load plugins written this way, so on those versions the plugin needs porting to API version 2 (see “Installing it on the server”).
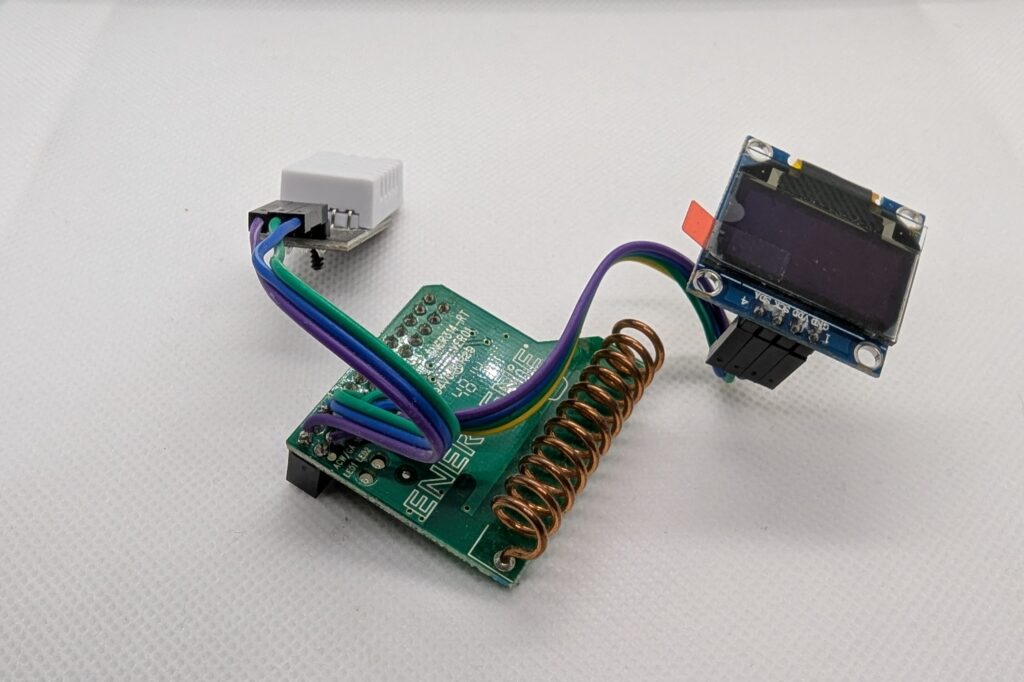
How it works
 DHT22 ───────────► rack-dht22.service ───────┐
                                              ├─► /run/rack-monitor/   ──► rack-display.service ──► OLED
 Mi|Home adapter ─► rack-energenie.service ───┘     (files, in RAM)   └─► Check_MK agent plugin ──► Check_MK
   (radio, via Pi-mote)                                                      (value + age of each reading)
Only two small services touch hardware: one reads the DHT22, one receives the radio messages from the power adapter. Each writes its latest reading to a tiny text file. Everything else, the display and the Check_MK agent plugin, just reads those files. That keeps the pieces independent, and it means two programs never fight over the same sensor.
A few design decisions worth explaining:
- The data files live in
/run, which is a RAM disk. The sensor is read every 10 seconds, and writing that often to an SD card would wear it out for no benefit. The files are rebuilt within seconds after every reboot. - Files are replaced atomically. A reader never sees a half-written file.
- Every reading carries its age. The agent plugin sends the value and how many seconds ago it was updated. If the sensor script dies, or the radio goes quiet, Check_MK sees stale data and alerts. That’s the failure I care about most: a dead monitor during a heatwave looks exactly like “everything is fine” unless you check for it.
- systemd services. They start on boot, restart themselves if they crash, and keep their logs in the journal. A script launched from cron has none of that: if it dies, nothing restarts it and you may never know.
Building the unit
The order of the build matters, because of how the Pi-mote fits.
Fit the Pi-mote first
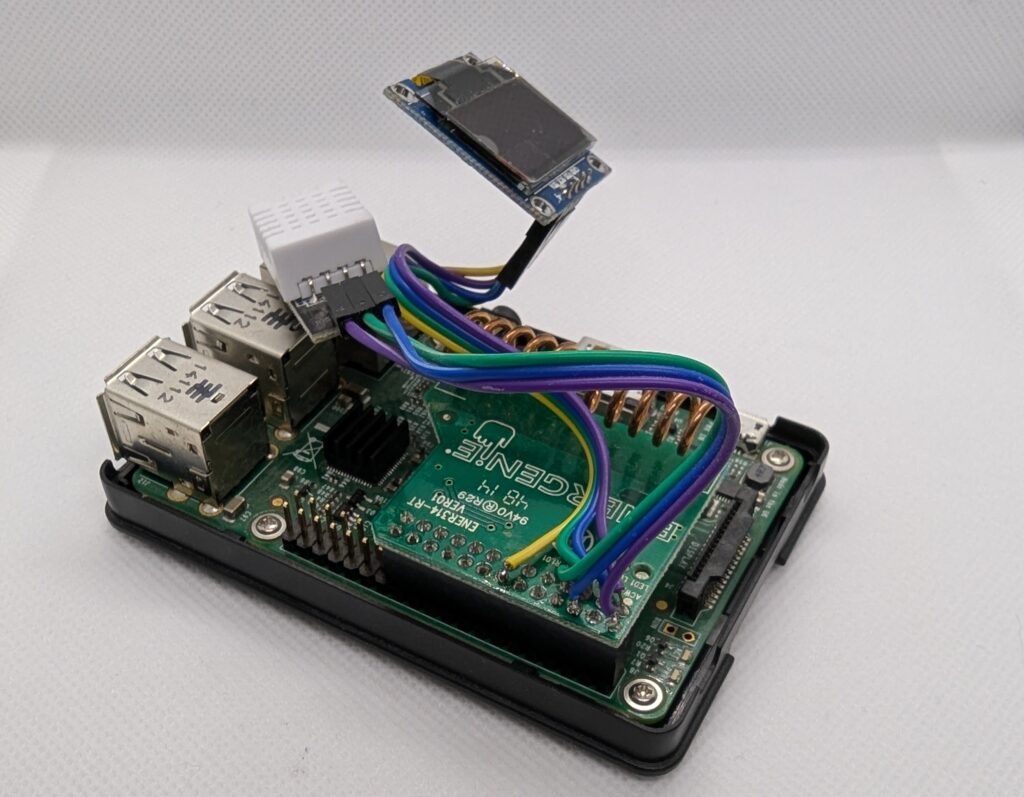
The Pi-mote is a HAT: a board that plugs onto the Pi’s 40-pin GPIO header and sits over the top of it. I fitted it first. It covers pins 1 to 26 of the header, and every pin in the wiring table below (3.3V, GND, GPIO 4, SDA and SCL) is among them, so there was nowhere to push jumper leads onto those pins for the DHT22 or the display.
Connecting the DHT22 and the display
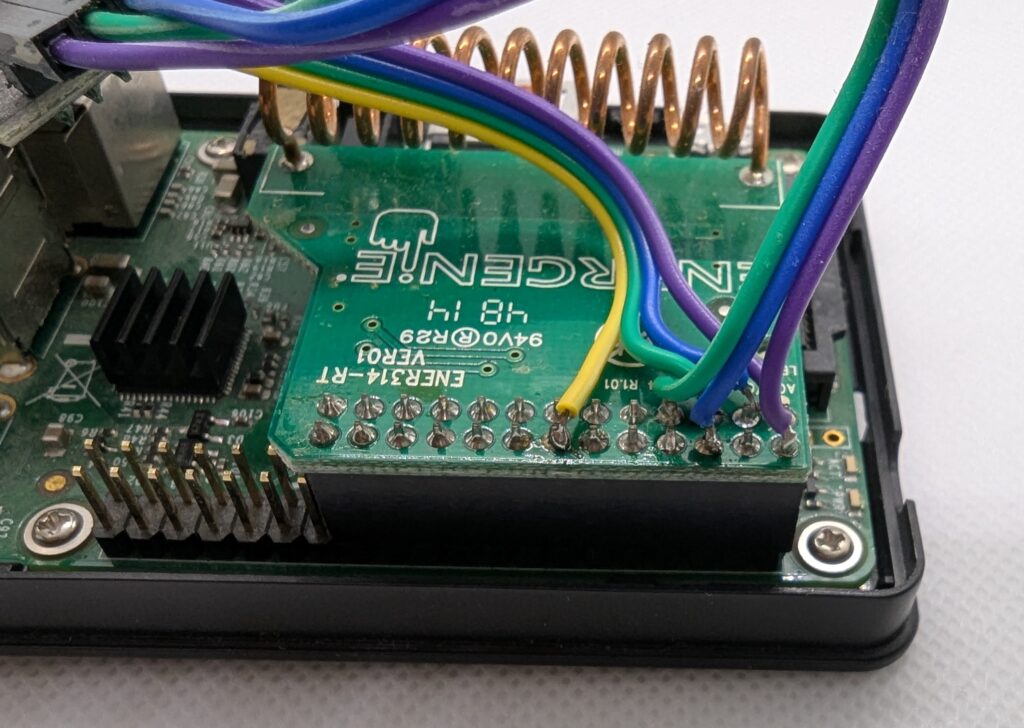
Because those pins are covered, I soldered the wires for the DHT22 and for the display straight onto the Pi-mote, at the pins that carry the connections we need.
The pin numbers below are the usual ones for a Raspberry Pi 40-pin header. Check them against a pinout for your own board. The Pi-mote’s radio uses SPI and a few other pins of its own; in my build none of those clash with the connections below.
| Device | Pin | Header pin |
|---|---|---|
| DHT22 | VCC / + | 3.3V (pin 1) |
| DHT22 | OUT / data | GPIO 4 (pin 7) |
| DHT22 | GND / – | GND (pin 9) |
| OLED | VDD | 3.3V (pin 17) |
| OLED | GND | GND (pin 14) |
| OLED | SDA | GPIO 2 / SDA (pin 3) |
| OLED | SCK | GPIO 3 / SCL (pin 5) |
Power the DHT22 from 3.3V, not 5V. With a 5V supply its data line can rise above what the Pi’s GPIO pins tolerate.
A few practical tips for soldering onto a board that’s already fitted:
- Switch the Pi off and unplug it first.
- Keep the joints small and tidy, and check that no solder is bridging neighbouring pins.
- Test each joint for continuity before powering up.
- Leave a little slack in the wires, or secure them, so tugging a cable doesn’t pull on a joint. You’ll be routing the sensor cable away from the unit (see “Sensor placement” below), so the wires will get handled.
Making room for the antenna
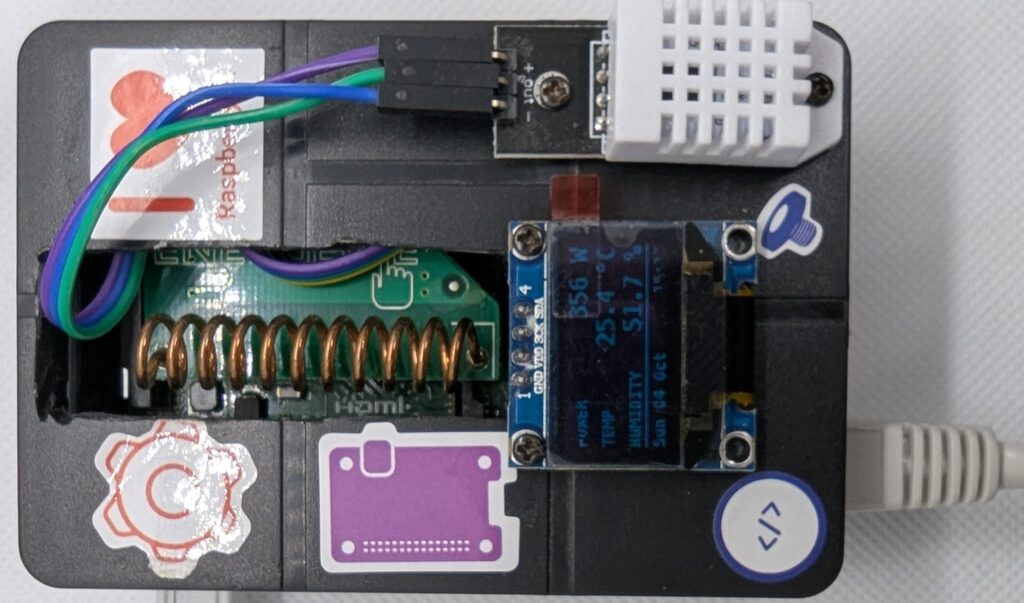
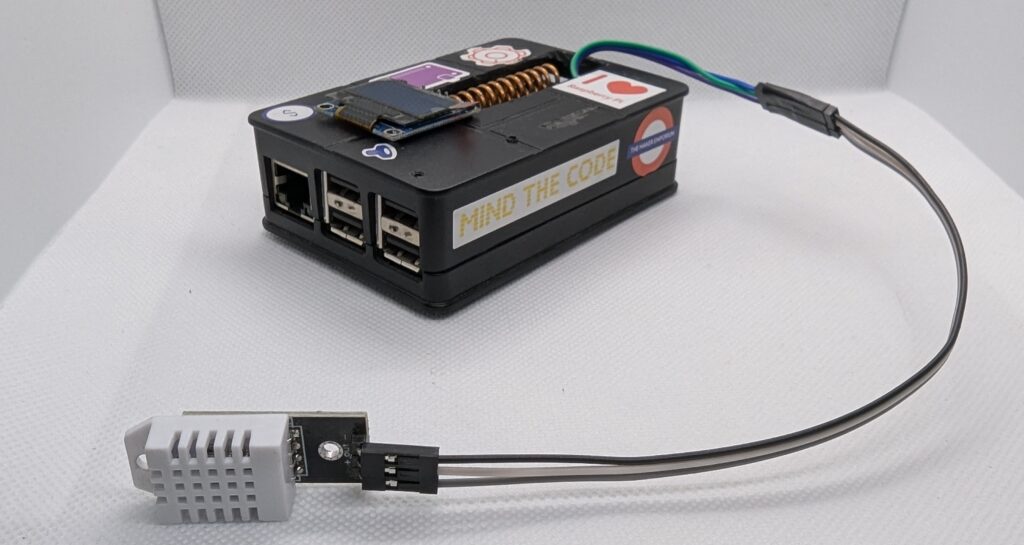
The Pi-mote has a copper coil, its antenna, which sticks up from the board. A normal case lid would press down on it. So I cut a long rectangular opening in the lid with a Dremel rotary tool. The coil sits in the opening, and the lid closes properly without touching it.
Take your time with this part. Mark the opening from the coil’s actual position and size, make the cut a little larger than the coil, and smooth the edges so they can’t catch the wires or the antenna. If you use a rotary tool as I did, clamp the lid down, wear eye protection, and use a cutting disc at a low speed, because plastic melts if the tool runs too fast. Finish the edges with a file or a sanding bit. Then close the lid and check nothing is pressing on the coil. The coil is how the unit hears the power adapter, so you don’t want it squashed or bent.
Sensor placement: a lesson learned
I first attached the DHT22 straight onto the Raspberry Pi case. It read about 25 °C while the room was 20 °C. The Pi itself was running at about 42 °C, and its heat was adding roughly 5 °C to the sensor’s reading, so my sensor was partly measuring the Pi, not the room.
Humidity was affected as well. Relative humidity depends on temperature, so air that is warmed reads drier than it really is, which means a temperature error carries over into the humidity reading.
Five degrees might not sound like much, but alert thresholds depend on it. With a warning level at 30 °C, an error of 5 °C uses up a large part of your margin. It isn’t a fixed offset you can simply subtract either, because the Pi’s temperature changes with how hard it’s working.
So put the sensor on a cable and place it where it measures what matters, which is the air your servers breathe. That usually means the intake side of the rack at about mid-height. Avoid the exhaust, the top of a piece of equipment, and anywhere near a power supply or the Pi.
The DHT22 uses a single data wire, so a few practical notes on the cable:
- Up to 2 to 3 metres should work as it is.
- For longer runs, add a 4.7 kΩ pull-up resistor between data and 3.3V. Many 3-pin breakout boards already have one built in, so try without first.
- Ethernet cable works well: data on one wire of a twisted pair, ground on its partner.
- Keep it away from mains cables.
If a longer cable causes read errors, the reader service logs a warning (shown later in the troubleshooting section) and Check_MK raises a stale-data alert.
I moved the sensor off the case and onto its own extension cable, away from the unit. The only change to the build was the cable: no software changes were needed.
Preparing the Pi
With the hardware built, it’s time for the software. Install Raspberry Pi OS, then enable the interfaces we need. The OLED uses I2C and the Pi-mote’s radio uses SPI:
sudo raspi-config # Interface Options: enable I2C and SPI, then reboot
Install the supporting packages and the libraries the scripts use:
sudo apt update
sudo apt install -y git i2c-tools python3-pip python3-pil python3-spidev python3-rpi.gpio fonts-dejavu-core
sudo pip3 install Adafruit_DHT Adafruit-SSD1306
Adafruit_DHT and Adafruit_SSD1306 are Adafruit’s older libraries. They’re deprecated in favour of the CircuitPython versions, but they still work, they run fine on a Pi 2, and they’re what I’m using here. If your Pi OS release complains about installing with pip, check Adafruit’s current instructions for the legacy libraries.
For the Energenie radio I use the pyenergenie library. The install script downloads it for you into /opt/pyenergenie if it isn’t already there, or you can fetch it yourself:
sudo git clone --depth 1 https://github.com/whaleygeek/pyenergenie.git /opt/pyenergenie
It goes in /opt, not in a home folder, for a practical reason: the receiver service runs as root, and root shouldn’t execute code that an ordinary user’s account can edit. A root-owned folder also means the setup doesn’t depend on which user installed it. The receiver only needs the path to the library’s src folder, which is set in the config file below (PYENERGENIE_SRC).
Once the unit is built (see the previous section) and I2C is enabled, check that the display is detected on the I2C bus. You should see 3c in the table that’s printed:
sudo i2cdetect -y 1
The scripts
You don’t need to copy these files across one by one. Everything in this section, the Python programs, the config file, the systemd services and the Check_MK agent plugin, is installed by a single script: install.sh. Once the Pi is prepared (see the previous section), download the package, unzip it and run the script. The rest of the section then shows what each file does, so you can understand, change or rebuild any part of it.
The package mirrors where the files end up on the Pi:
rack-monitor/
├── install.sh
├── pi/
│   ├── opt/rack-monitor/           the Python programs
│   ├── etc/rack-monitor/           the config file
│   ├── etc/tmpfiles.d/             creates the RAM data folder at boot
│   ├── etc/systemd/system/         the three services
│   └── usr/lib/check_mk_agent/plugins/rack_monitor
└── server/rack_monitor.py          the Check_MK server-side plugin
Installing everything with install.sh
unzip rack-monitor.zip
cd rack-monitor
sudo chmod +x install.sh
sudo ./install.sh
Here’s what the script does, in order:
- Checks that it’s running as root and that the package folder is intact.
- Finds a Python that has the
Adafruit_DHTlibrary installed (override it withPYTHON=/path/to/python). - Creates an unprivileged
rackmonuser for the display service. - Copies the Python programs to
/opt/rack-monitor/and the config file to/etc/rack-monitor/. An existing config file is never overwritten. - Downloads pyenergenie into
/opt/pyenergenieif it isn’t already there. - Adds a tmpfiles rule so the RAM data folder,
/run/rack-monitor, exists after every boot. - Installs the three systemd services, fills in the Python path, and enables and starts them.
- Installs the Check_MK agent plugin, if the Check_MK agent is present.
It’s safe to run again to upgrade. The one piece it doesn’t install is the server-side check plugin, which goes on your Check_MK server (see “Installing it on the server” below).
install.sh
#!/bin/sh
# Installs the rack monitor on the Raspberry Pi. Safe to run again to upgrade;
# an existing /etc/rack-monitor/rack-monitor.conf is never overwritten.
#
#   sudo ./install.sh
#   sudo PYTHON=/usr/bin/python2 ./install.sh     # force a particular Python
set -eu

[ "$(id -u)" -eq 0 ] || { echo "Run as root:  sudo ./install.sh" >&2; exit 1; }
HERE=$(cd "$(dirname "$0")" && pwd)
SRC="$HERE/pi"

if [ ! -d "$SRC/opt/rack-monitor" ]; then
    echo "Cannot find $SRC/opt/rack-monitor." >&2
    echo "install.sh must sit next to the 'pi' folder from the zip, like this:" >&2
    echo "  rack-monitor/install.sh  rack-monitor/pi/...  rack-monitor/server/..." >&2
    echo "Unzip the whole archive and run it from inside the rack-monitor folder." >&2
    exit 1
fi

# Use the Python that already has the Adafruit libraries installed.
PYTHON=${PYTHON:-}
if [ -z "$PYTHON" ]; then
    for p in python3 python python2; do
        if command -v "$p" >/dev/null 2>&1 && "$p" -c 'import Adafruit_DHT' >/dev/null 2>&1; then
            PYTHON=$(command -v "$p")
            break
        fi
    done
fi
[ -n "$PYTHON" ] || { echo "No Python with Adafruit_DHT found. Install it, or set PYTHON=/path/to/python" >&2; exit 1; }
echo "Using Python: $PYTHON"

# Unprivileged user for the display service.
id rackmon >/dev/null 2>&1 || useradd --system --no-create-home --shell /usr/sbin/nologin rackmon

install -d -m 755 /opt/rack-monitor /etc/rack-monitor
install -m 644 "$SRC"/opt/rack-monitor/*.py /opt/rack-monitor/

if [ -f /etc/rack-monitor/rack-monitor.conf ]; then
    echo "Keeping existing /etc/rack-monitor/rack-monitor.conf"
else
    install -m 644 "$SRC/etc/rack-monitor/rack-monitor.conf" /etc/rack-monitor/rack-monitor.conf
fi

# The Energenie radio library. Kept in a root-owned folder (not a home folder)
# because the receiver service runs as root and must not execute code that a
# normal user can edit. Downloaded here only if the configured path is missing.
CONFIGURED_SRC=$(. /etc/rack-monitor/rack-monitor.conf; echo "${PYENERGENIE_SRC:-}")
if [ ! -d "$CONFIGURED_SRC/energenie" ]; then
    if [ "$CONFIGURED_SRC" = "/opt/pyenergenie/src" ] && command -v git >/dev/null 2>&1; then
        echo "Downloading pyenergenie to /opt/pyenergenie ..."
        git clone --depth 1 https://github.com/whaleygeek/pyenergenie.git /opt/pyenergenie \
            || echo "WARNING: could not download pyenergenie; see README.md" >&2
    else
        echo "WARNING: PYENERGENIE_SRC ($CONFIGURED_SRC) does not contain the 'energenie' package." >&2
        echo "         Install pyenergenie there (see README.md) or fix the path in /etc/rack-monitor/rack-monitor.conf" >&2
    fi
fi

install -m 644 "$SRC/etc/tmpfiles.d/rack-monitor.conf" /etc/tmpfiles.d/rack-monitor.conf
systemd-tmpfiles --create /etc/tmpfiles.d/rack-monitor.conf

for unit in rack-dht22 rack-energenie rack-display; do
    sed "s|@PYTHON@|$PYTHON|" "$SRC/etc/systemd/system/$unit.service" > "/etc/systemd/system/$unit.service"
    chmod 644 "/etc/systemd/system/$unit.service"
done

# Check_MK agent plugin.
PLUGINS=/usr/lib/check_mk_agent/plugins
if [ -d "$PLUGINS" ]; then
    install -m 755 "$SRC/usr/lib/check_mk_agent/plugins/rack_monitor" "$PLUGINS/rack_monitor"
else
    echo "WARNING: $PLUGINS not found - install the Check_MK agent, then copy the plugin by hand." >&2
fi

systemctl daemon-reload
systemctl enable --now rack-dht22.service rack-energenie.service rack-display.service

echo
echo "Installed. Check the services with:"
echo "  systemctl status rack-dht22 rack-energenie rack-display"
echo "  journalctl -u rack-dht22 -u rack-energenie -u rack-display -f"
echo "Then install server/rack_monitor.py on the Check_MK server (see README.md)."
Check it works
systemctl status rack-dht22 rack-energenie rack-display
ls -l /run/rack-monitor/
cat /run/rack-monitor/energenie_0x354
Within a minute you should see temperature, humidity and an energenie_... file in /run/rack-monitor/, and the display should show live values.
If your adapter’s sensor ID isn’t 0x354, the energenie_... file will have a different name. Set the right ID in /etc/rack-monitor/rack-monitor.conf and run sudo systemctl restart rack-energenie; the troubleshooting section below shows how to find it.
What gets installed
The rest of this section goes through each file that install.sh puts on the Pi and what it contains.
Configuration
All settings live in one file. It’s read by systemd and by the Check_MK agent plugin, so it has to be plain KEY=value lines.
/etc/rack-monitor/rack-monitor.conf
# /etc/rack-monitor/rack-monitor.conf
#
# Shared settings for the rack monitor services and the Check_MK agent plugin.
# Plain KEY=value lines only (no spaces around "=", no "export"): this file is
# read by systemd (EnvironmentFile) and sourced by a shell script.
#
# After editing:  sudo systemctl restart rack-dht22 rack-energenie rack-display

# Where the live readings are kept. /run is a RAM disk, so the frequent
# updates never wear out the Pi's SD card. Contents are rebuilt after a reboot.
RACK_DATA_DIR=/run/rack-monitor

# DHT22: GPIO pin (BCM numbering) and seconds between readings (minimum 2).
DHT_GPIO_PIN=4
DHT_INTERVAL=10

# Energenie: folder containing the "energenie" Python package (the "src" folder
# of the pyenergenie library). install.sh downloads pyenergenie to /opt/pyenergenie
# if it is not there. It is kept outside any home folder because the receiver
# service runs as root. ENERGENIE_SENSOR_ID is the sensor ID of your Mi|Home
# Monitor adapter, as logged by the receiver, e.g. 0x354.
PYENERGENIE_SRC=/opt/pyenergenie/src
ENERGENIE_SENSOR_ID=0x354

# OLED display: 64 for a 128x64 panel, 32 for 128x32. Refresh in seconds.
OLED_HEIGHT=64
OLED_REFRESH=1
# Optional: path to a bold TrueType font for the large values. Leave unset to
# use DejaVu Sans Mono Bold (sudo apt install fonts-dejavu-core).
#OLED_FONT=/usr/share/fonts/truetype/dejavu/DejaVuSansMono-Bold.ttf

# The display shows "--" for any reading older than this many seconds.
MAX_DATA_AGE=120

# DEBUG logs every radio message, INFO (default) only logs problems and startup.
RACK_LOG_LEVEL=INFO
Set ENERGENIE_SENSOR_ID to your adapter’s ID. If you don’t know it, see the troubleshooting section for how to find it. If you keep pyenergenie somewhere other than /opt/pyenergenie, set PYENERGENIE_SRC to the src folder inside it.
Shared helpers
A small module used by all three programs: logging, atomic file writes, and the “how old is this file” check.
/opt/rack-monitor/rack_common.py
"""Helpers shared by the rack monitor scripts.

Settings come from environment variables, which systemd fills in from
/etc/rack-monitor/rack-monitor.conf. Works on Python 2.7 and 3.
"""

import logging
import os
import signal
import sys
import time

DATA_DIR = os.environ.get("RACK_DATA_DIR", "/run/rack-monitor")
TEMPERATURE_FILE = os.path.join(DATA_DIR, "temperature")
HUMIDITY_FILE = os.path.join(DATA_DIR, "humidity")


def env_int(name, default):
    try:
        return int(os.environ.get(name, default))
    except ValueError:
        return default


def get_logger(name):
    """Log to stderr; systemd stores it in the journal with timestamps."""
    level = getattr(logging, os.environ.get("RACK_LOG_LEVEL", "INFO").upper(), logging.INFO)
    logging.basicConfig(stream=sys.stderr, level=level,
                        format="%(name)s: %(levelname)s: %(message)s")
    return logging.getLogger(name)


def install_signal_handlers():
    """Turn SIGTERM (systemctl stop) into a normal exit so cleanup code runs."""
    signal.signal(signal.SIGTERM, lambda signum, frame: sys.exit(0))


def energenie_file(sensor_id):
    """Path of the data file for an Energenie sensor, e.g. .../energenie_0x354."""
    try:
        sensor_id = hex(int(str(sensor_id), 0))
    except ValueError:
        sensor_id = str(sensor_id)
    return os.path.join(DATA_DIR, "energenie_" + sensor_id)


def write_atomic(path, text):
    """Replace a file in one step so readers never see it empty or half-written."""
    if not os.path.isdir(DATA_DIR):
        os.makedirs(DATA_DIR)
    tmp_path = "%s.tmp%d" % (path, os.getpid())
    with open(tmp_path, "w") as f:
        f.write(text)
    os.rename(tmp_path, path)


def file_age(path):
    """Seconds since the file was last updated, or None if it does not exist."""
    try:
        return time.time() - os.path.getmtime(path)
    except OSError:
        return None


def read_first_line(path, max_age=None):
    """First line of a file, or None if missing, empty or older than max_age."""
    age = file_age(path)
    if age is None or (max_age is not None and age > max_age):
        return None
    try:
        with open(path) as f:
            return f.readline().strip() or None
    except IOError:
        return None
Reading the temperature and humidity
This is the only program that talks to the DHT22. It rejects readings outside the sensor’s valid range, and it writes a value only when the reading is valid. That matters: a stale file is the signal that the sensor has failed. It also logs a failure once and then only every 30th time, so a dead sensor doesn’t flood the journal.
/opt/rack-monitor/dht22_reader.py
#!/usr/bin/env python3
"""Read the DHT22 sensor and publish temperature and humidity to the data dir.

This is the only program that talks to the sensor. The OLED display and the
Check_MK agent plugin just read the files it writes. A value is only written
when the reading is valid, so a file that stops being updated means the sensor
has stopped working (the Check_MK check alerts on that).
"""

import time

import Adafruit_DHT

from rack_common import (HUMIDITY_FILE, TEMPERATURE_FILE, env_int, get_logger,
                         install_signal_handlers, write_atomic)

log = get_logger("dht22")

SENSOR = Adafruit_DHT.DHT22
GPIO_PIN = env_int("DHT_GPIO_PIN", 4)
READ_INTERVAL = max(2, env_int("DHT_INTERVAL", 10))   # DHT22 needs >= 2 s

# Datasheet limits; anything outside is treated as a failed reading.
TEMPERATURE_RANGE = (-40.0, 80.0)
HUMIDITY_RANGE = (0.0, 100.0)

LOG_EVERY_N_FAILURES = 30


def valid(value, limits):
    return value is not None and limits[0] <= value <= limits[1]


def main():
    install_signal_handlers()
    log.info("starting: GPIO %d, every %d s", GPIO_PIN, READ_INTERVAL)
    failures = 0

    while True:
        try:
            humidity, temperature = Adafruit_DHT.read_retry(SENSOR, GPIO_PIN)
        except RuntimeError as e:
            humidity = temperature = None
            log.debug("read error: %s", e)

        temperature_ok = valid(temperature, TEMPERATURE_RANGE)
        humidity_ok = valid(humidity, HUMIDITY_RANGE)
        if temperature_ok:
            write_atomic(TEMPERATURE_FILE, "%.1f\n" % temperature)
        if humidity_ok:
            write_atomic(HUMIDITY_FILE, "%.1f\n" % humidity)

        # Log problems once, then every Nth time, so the journal is not flooded.
        if temperature_ok and humidity_ok:
            if failures:
                log.info("sensor readings recovered after %d failed attempts", failures)
            failures = 0
        else:
            failures += 1
            if failures == 1 or failures % LOG_EVERY_N_FAILURES == 0:
                log.warning("no valid reading from DHT22 (%d failed attempts in a row)", failures)

        time.sleep(READ_INTERVAL)


if __name__ == "__main__":
    main()
Reading the power adapter
This listens for radio messages from the Mi|Home adapter and writes each sensor’s latest values to energenie_<sensor id>, one name value unit line per record, for example REAL_POWER 368 W. It sleeps briefly when nothing is waiting, so it doesn’t use a full CPU core.
/opt/rack-monitor/energenie_receiver.py
#!/usr/bin/env python3
"""Receive Energenie Mi|Home radio messages and save each sensor's readings.

Every sensor that reports gets a file named energenie_<sensor id> in the data
directory, one "<name> <value> <unit>" line per record, for example:

    REAL_POWER 142 W

The OLED display and the Check_MK agent plugin read those files.
"""

import os
import sys
import time

# The pyenergenie library lives outside /opt/rack-monitor; add it to the path.
_src = os.environ.get("PYENERGENIE_SRC")
if _src and _src not in sys.path:
    sys.path.insert(0, _src)

from energenie import Registry, Devices, OpenThings, radio  # noqa: E402

from rack_common import (DATA_DIR, energenie_file, get_logger,  # noqa: E402
                         install_signal_handlers, write_atomic)

log = get_logger("energenie")


def format_records(records):
    """Turn decoded records into 'name value unit' lines."""
    return ["%s %s %s" % (rec["paramname"], rec.get("value"), rec["paramunit"])
            for rec in records]


def handle_message(msg):
    header = msg["header"]
    sensor_id = hex(header["sensorid"])
    lines = format_records(msg["recs"])

    log.debug("mfrid=%s prodid=%s sensorid=%s: %s",
              hex(header["mfrid"]), hex(header["productid"]), sensor_id, "; ".join(lines))

    # Messages without records (e.g. join requests) carry no readings, so keep
    # the previous values instead of overwriting them with nothing.
    if lines:
        write_atomic(energenie_file(sensor_id), "\n".join(lines) + "\n")


def receive_loop():
    radio.receiver()
    while True:
        if not radio.is_receive_waiting():
            time.sleep(0.05)       # do not spin a CPU core at 100%
            continue

        payload = radio.receive()
        try:
            decoded = OpenThings.decode(payload)
        except OpenThings.OpenThingsException as e:
            log.warning("could not decode payload: %s", e)
            continue

        handle_message(decoded)
        Registry.update(decoded)   # keeps pyenergenie's list of known devices current


def main():
    install_signal_handlers()
    log.info("starting: writing sensor files to %s", DATA_DIR)
    radio.init()
    OpenThings.init(Devices.CRYPT_PID)
    try:
        receive_loop()
    finally:
        radio.finished()


if __name__ == "__main__":
    main()
The display
This reads the same files and draws them on the OLED: a small label on the left, a large value on the right, and a date and time footer. Text is drawn in a TrueType font and then converted to pure black and white without dithering, which keeps the characters crisp. It only redraws when something has changed, because sending a frame over I2C is slow and would otherwise use a noticeable share of an older Pi’s CPU.
If a reading is missing or older than MAX_DATA_AGE seconds, it shows -- instead of a misleading old value.
/opt/rack-monitor/oled_display.py
#!/usr/bin/env python3
"""Show power, temperature and humidity on an SSD1306 OLED (I2C).

This program only reads the data files written by dht22_reader.py and
energenie_receiver.py, so it needs no root access and never touches the
sensors. Any reading older than MAX_DATA_AGE seconds is shown as "--".

Layout (128x64): three rows, each with a small label on the left and a large
value on the right, and a small date/time footer. Text is drawn with a
TrueType font and then thresholded to pure black/white, which keeps the
characters crisp on a 1-bit display.
"""

import os
import time

import Adafruit_SSD1306
from PIL import Image, ImageDraw, ImageFont

from rack_common import (HUMIDITY_FILE, TEMPERATURE_FILE, energenie_file, env_int, file_age,
                         get_logger, install_signal_handlers, read_first_line)

log = get_logger("display")

DISPLAY_HEIGHT = env_int("OLED_HEIGHT", 64)
REFRESH = max(1, env_int("OLED_REFRESH", 1))
MAX_AGE = env_int("MAX_DATA_AGE", 120)
POWER_FILE = energenie_file(os.environ.get("ENERGENIE_SENSOR_ID", "0x354"))
POWER_PARAM = "REAL_POWER"

# First font that exists wins. Set OLED_FONT in the config to use your own.
# On Raspberry Pi OS:  sudo apt install fonts-dejavu-core
BOLD_FONTS = [
    os.environ.get("OLED_FONT", ""),
    "/usr/share/fonts/truetype/dejavu/DejaVuSansMono-Bold.ttf",
    "/usr/share/fonts/truetype/liberation/LiberationMono-Bold.ttf",
    "/usr/share/fonts/truetype/freefont/FreeMonoBold.ttf",
]
# Small text is clearer in a regular weight; bold clogs up at 10 pixels.
REGULAR_FONTS = [
    "/usr/share/fonts/truetype/dejavu/DejaVuSansMono.ttf",
    "/usr/share/fonts/truetype/liberation/LiberationMono-Regular.ttf",
    "/usr/share/fonts/truetype/freefont/FreeMono.ttf",
]


def load_font(size, bold=True):
    """A TrueType font of the given pixel size, or None if none is installed."""
    for path in (BOLD_FONTS if bold else REGULAR_FONTS + BOLD_FONTS):
        if path and os.path.exists(path):
            try:
                return ImageFont.truetype(path, size)
            except IOError:
                continue
    return None


def text_width(draw, text, font):
    if hasattr(draw, "textbbox"):                  # Pillow 8+
        left, _, right, _ = draw.textbbox((0, 0), text, font=font)
        return right - left
    return draw.textsize(text, font=font)[0]       # older Pillow


def read_number(path):
    text = read_first_line(path, MAX_AGE)
    try:
        return float(text)
    except (TypeError, ValueError):
        return None


def read_power():
    """Wattage from the Energenie sensor file, or None if missing or stale."""
    age = file_age(POWER_FILE)
    if age is None or age > MAX_AGE:
        return None
    try:
        with open(POWER_FILE) as f:
            for line in f:
                parts = line.split()
                if len(parts) >= 2 and parts[0] == POWER_PARAM:
                    return float(parts[1])
    except (IOError, ValueError):
        pass
    return None


def fmt(value, template):
    return u"--" if value is None else template.format(value)


class Screen(object):
    """Draws the rows and footer, sized to fit the whole display."""

    def __init__(self, width, height):
        self.width = width
        self.height = height
        self.canvas = Image.new("L", (width, height))   # grey canvas, thresholded on output
        self.draw = ImageDraw.Draw(self.canvas)

        footer_h = 12 if height >= 64 else 0
        self.footer_h = footer_h
        self.row_h = (height - footer_h) // 3
        value_font = load_font(max(8, self.row_h - 2))
        self.truetype = value_font is not None
        self.value_font = value_font or ImageFont.load_default()
        self.label_font = load_font(max(8, int(self.row_h * 0.6)), bold=False) or ImageFont.load_default()
        self.footer_font = load_font(10, bold=False) or ImageFont.load_default()
        self.degree = u"\u00b0" if self.truetype else u""

    def render(self, rows, footer):
        """rows: [(label, value)] x3; footer: (left_text, right_text) or None."""
        d = self.draw
        d.rectangle((0, 0, self.width, self.height), outline=0, fill=0)

        for i, (label, value) in enumerate(rows):
            top = i * self.row_h
            value_size = self.value_font.size if hasattr(self.value_font, "size") else self.row_h
            label_size = self.label_font.size if hasattr(self.label_font, "size") else 8
            d.text((0, top + (self.row_h - label_size) // 2 + 1), label,
                   font=self.label_font, fill=255)
            x = self.width - text_width(d, value, self.value_font) - 1
            d.text((x, top + (self.row_h - value_size) // 2 - 1), value,
                   font=self.value_font, fill=255)

        if footer and self.footer_h:
            line_y = self.height - self.footer_h - 1
            d.line((0, line_y, self.width, line_y), fill=255)
            y = self.height - 11
            d.text((0, y), footer[0], font=self.footer_font, fill=255)
            x = self.width - text_width(d, footer[1], self.footer_font) - 1
            d.text((x, y), footer[1], font=self.footer_font, fill=255)

        # Threshold to pure black/white instead of dithering, then 1-bit mode.
        return self.canvas.point(lambda p: 255 if p >= 128 else 0).convert("1")


def main():
    install_signal_handlers()
    if DISPLAY_HEIGHT == 64:
        disp = Adafruit_SSD1306.SSD1306_128_64(rst=None)
    else:
        disp = Adafruit_SSD1306.SSD1306_128_32(rst=None)
    disp.begin()
    disp.clear()
    disp.display()
    log.info("starting: 128x%d display", DISPLAY_HEIGHT)

    screen = Screen(disp.width, disp.height)
    if not screen.truetype:
        log.warning("no TrueType font found, using the small built-in font "
                    "(sudo apt install fonts-dejavu-core)")

    last_frame = None
    try:
        while True:
            now = time.localtime()
            rows = [
                (u"POWER", fmt(read_power(), u"{0:.0f} W")),
                (u"TEMP", fmt(read_number(TEMPERATURE_FILE), u"{0:.1f} " + screen.degree + u"C")),
                (u"HUMIDITY", fmt(read_number(HUMIDITY_FILE), u"{0:.1f} %")),
            ]
            footer = (time.strftime("%a %d %b", now), time.strftime("%H:%M", now))

            # Sending a frame over I2C is slow and CPU-heavy on an old Pi, so
            # only redraw when something on screen has actually changed.
            frame = (tuple(rows), footer)
            if frame != last_frame:
                disp.image(screen.render(rows, footer))
                disp.display()
                last_frame = frame
            time.sleep(REFRESH)
    finally:
        disp.clear()
        disp.display()


if __name__ == "__main__":
    main()
The services and the data folder
First, a tiny tmpfiles rule that creates the RAM-backed data folder at every boot:
/etc/tmpfiles.d/rack-monitor.conf
# Creates the RAM-backed data directory at every boot.
d /run/rack-monitor 0755 root root -
Then one service per program. @PYTHON@ is filled in by install.sh with whichever Python has the Adafruit libraries installed.
The DHT22 reader and the radio receiver run as root because the libraries need direct hardware access (/dev/mem and SPI/GPIO), but they’re locked down with NoNewPrivileges and a read-only system. The display only needs I2C, so it runs as its own unprivileged rackmon user. All three restart automatically if they fail.
/etc/systemd/system/rack-dht22.service
[Unit]
Description=Rack monitor - DHT22 temperature and humidity reader
After=local-fs.target
StartLimitIntervalSec=0

[Service]
Type=simple
# Adafruit_DHT reads the GPIO pin through /dev/mem, which needs root.
EnvironmentFile=/etc/rack-monitor/rack-monitor.conf
ExecStart=@PYTHON@ /opt/rack-monitor/dht22_reader.py
Restart=always
RestartSec=10
NoNewPrivileges=yes
PrivateTmp=yes
ProtectSystem=full

[Install]
WantedBy=multi-user.target
/etc/systemd/system/rack-energenie.service
[Unit]
Description=Rack monitor - Energenie Mi|Home radio receiver
After=local-fs.target
StartLimitIntervalSec=0

[Service]
Type=simple
# The radio is driven over SPI/GPIO by pyenergenie, which is run as root.
EnvironmentFile=/etc/rack-monitor/rack-monitor.conf
ExecStart=@PYTHON@ /opt/rack-monitor/energenie_receiver.py
Restart=always
RestartSec=10
NoNewPrivileges=yes
PrivateTmp=yes
ProtectSystem=full

[Install]
WantedBy=multi-user.target
/etc/systemd/system/rack-display.service
[Unit]
Description=Rack monitor - OLED status display
After=rack-dht22.service rack-energenie.service
StartLimitIntervalSec=0

[Service]
Type=simple
# Only needs the i2c group, so it does not run as root.
User=rackmon
SupplementaryGroups=i2c
EnvironmentFile=/etc/rack-monitor/rack-monitor.conf
ExecStart=@PYTHON@ /opt/rack-monitor/oled_display.py
Restart=always
RestartSec=10
NoNewPrivileges=yes
PrivateTmp=yes
ProtectSystem=strict
ProtectHome=yes

[Install]
WantedBy=multi-user.target
Sending the data to Check_MK
The agent plugin
install.sh has already copied the agent plugin into place. The Check_MK agent runs every script in its plugins folder and sends the output to the server. This plugin reads the data files and prints one section for each value, followed by the value and its age in seconds:
<<<room_temp>>>
23.2 0
<<<room_humidity>>>
52.8 0
<<<power_usage>>>
368 2
A missing or empty data file is reported as a single -, which the server treats as “no reading”.
/usr/lib/check_mk_agent/plugins/rack_monitor
#!/bin/sh
# Check_MK agent plugin: /usr/lib/check_mk_agent/plugins/rack_monitor
#
# Sends one section per reading: the value, then the number of seconds since
# its data file was last updated, so the server can spot stale data:
#
#     <<<room_temp>>>
#     24.3 5          <- value, then seconds since the data file was updated
#
# A missing or empty data file is reported as a single "-".

RACK_DATA_DIR=/run/rack-monitor
ENERGENIE_SENSOR_ID=0x354
[ -r /etc/rack-monitor/rack-monitor.conf ] && . /etc/rack-monitor/rack-monitor.conf

emit_section() {
    section=$1
    file=$2
    value=$3
    echo "<<<$section>>>"
    if [ -n "$value" ]; then
        age=$(( $(date +%s) - $(stat -c %Y "$file") ))
        echo "$value $age"
    else
        echo "-"
    fi
}

TEMP_FILE="$RACK_DATA_DIR/temperature"
HUMIDITY_FILE="$RACK_DATA_DIR/humidity"
POWER_FILE="$RACK_DATA_DIR/energenie_$ENERGENIE_SENSOR_ID"

emit_section room_temp     "$TEMP_FILE"     "$(head -n 1 "$TEMP_FILE" 2>/dev/null)"
emit_section room_humidity "$HUMIDITY_FILE" "$(head -n 1 "$HUMIDITY_FILE" 2>/dev/null)"
emit_section power_usage   "$POWER_FILE"    "$(awk '$1=="REAL_POWER"{print $2; exit}' "$POWER_FILE" 2>/dev/null)"
You can run it by hand to see exactly what Check_MK will receive:
sudo /usr/lib/check_mk_agent/plugins/rack_monitor
The server-side check
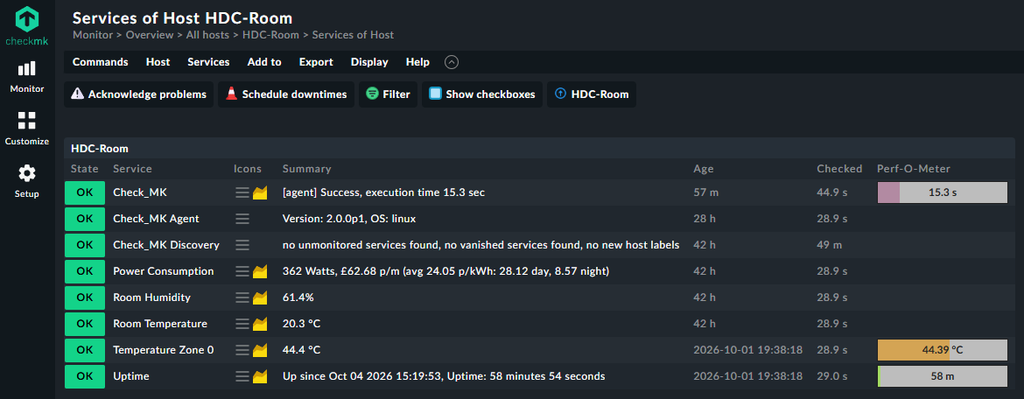
On the Check_MK server, the check plugin turns those sections into services: Room Temperature, Room Humidity and Power Consumption. The levels are all at the top of the file:
| Reading | Warning | Critical |
|---|---|---|
| Temperature, high | 30 °C | 35 °C |
| Temperature, low | 10 °C | 5 °C |
| Humidity, high | 75 % | 80 % |
| Humidity, low | 25 % | 15 % |
| Power | 480 W | 500 W |
| Data not updated for | 2 minutes | 5 minutes |
The low-side limits matter because of the cold winters: they alert when the room gets too cold or too dry, not only too hot. The low limits and the stale-data limits are my suggested starting values. Adjust everything to suit your own rack and room.
The stale-data alert is what protects you from a silent failure. If the Pi stays up but the sensor or the radio stops updating, the reading goes WARN and then CRIT even though the last value looked fine.
The cost estimate. The Power Consumption service also reports an estimated monthly cost as a Cost metric, based on the current load. My tariff is a time-of-day rate: 28.12 p/kWh during the day and 8.57 p/kWh between midnight and 5am. Because the check runs every minute, using the rate for the current minute would make the figure jump when the tariff switches. Instead it uses a blended daily rate:
(5 h × 8.57 p + 19 h × 28.12 p) ÷ 24 h = 24.05 p/kWh
At 368 W that gives 0.368 kW × 24 h × 30 days × 24.05 p ≈ £63.72 a month. This assumes the rack draws roughly the same power all day, which is a fair assumption for a server rack. Set your own rates and cheap-rate hours in the config block at the top of the file. The Cost levels (80 and 100) only draw lines on the graph; they don’t raise alerts.
~/local/lib/check_mk/base/plugins/agent_based/rack_monitor.py
#!/usr/bin/env python3
"""Checkmk checks for room temperature, humidity and rack power.

Written for Check API v1, which Checkmk supports from 2.0.0 to 2.3.0. Checkmk 2.4
no longer loads plugins from this folder, so on 2.4 or later this file has to be
ported to Check API v2.

Install on the Check_MK server, as the site user, at
    ~/local/lib/check_mk/base/plugins/agent_based/rack_monitor.py
then reload with:  cmk -R

The agent plugin sends one line per section: "<value> <age in seconds>".
The age is optional; without it the stale-data check is skipped.
"""

from .agent_based_api.v1 import (
    Metric,
    Result,
    Service,
    State,
    check_levels,
    register,
    render,
)

# ---- CONFIGURATION ----------------------------------------------------------
# Levels are (warn, crit). Upper levels alert when the value rises to them,
# lower levels when it falls to them.
TEMPERATURE_UPPER = (30.0, 35.0)     # degrees C
TEMPERATURE_LOWER = (10.0, 5.0)      # cold-weather alert (suggested values)
HUMIDITY_UPPER = (75.0, 80.0)        # percent
HUMIDITY_LOWER = (25.0, 15.0)        # suggested values
POWER_UPPER = (480, 500)             # watts

# Time-of-day tariff, pence per kWh. The cheap rate applies from NIGHT_START
# up to (not including) NIGHT_END, in hours of the day (0 = midnight).
DAY_PENCE_PER_KWH = 28.12
NIGHT_PENCE_PER_KWH = 8.57
NIGHT_START_HOUR = 0
NIGHT_END_HOUR = 5
COST_LEVELS = (80, 100)              # per month; drawn on the graph only, no alert

# No fresh data for this long -> WARN / CRIT (seconds).
STALE_AFTER = (120, 300)
# -----------------------------------------------------------------------------


def _average_pence_per_kwh():
    """Blended price over a full day, so the estimate does not jump at the
    tariff changeover. It assumes the rack draws the same power all day."""
    night_hours = (NIGHT_END_HOUR - NIGHT_START_HOUR) % 24
    day_hours = 24 - night_hours
    return (night_hours * NIGHT_PENCE_PER_KWH + day_hours * DAY_PENCE_PER_KWH) / 24.0


def _to_float(text):
    try:
        return float(text)
    except ValueError:
        return None


def parse_reading(string_table):
    """[['24.3', '5']] -> {'value': 24.3, 'age': 5.0}; [['-']] -> value None."""
    if not string_table or not string_table[0]:
        return None
    row = string_table[0]
    return {
        "value": _to_float(row[0]),
        "age": _to_float(row[1]) if len(row) > 1 else None,
    }


def _no_reading():
    return Result(
        state=State.CRIT,
        summary="No reading available (sensor or data file missing)",
    )


def _freshness(reading):
    """Alert when the Pi is up but the sensor or receiver has stopped updating."""
    age = reading["age"]
    if age is None or age < STALE_AFTER[0]:
        return
    yield Result(
        state=State.CRIT if age >= STALE_AFTER[1] else State.WARN,
        summary="Data is stale, last update %s ago" % render.timespan(age),
    )


def discover_reading(section):
    yield Service()


# ---- Room temperature -------------------------------------------------------
def check_room_temp(section):
    if section["value"] is None:
        yield _no_reading()
        return
    yield from check_levels(
        section["value"],
        levels_upper=TEMPERATURE_UPPER,
        levels_lower=TEMPERATURE_LOWER,
        metric_name="Temperature",
        render_func=lambda v: "%.1f \N{DEGREE SIGN}C" % v,
    )
    yield from _freshness(section)


# ---- Room humidity ----------------------------------------------------------
def check_room_humidity(section):
    if section["value"] is None:
        yield _no_reading()
        return
    yield from check_levels(
        section["value"],
        levels_upper=HUMIDITY_UPPER,
        levels_lower=HUMIDITY_LOWER,
        metric_name="Humidity",
        render_func=lambda v: "%.1f%%" % v,
    )
    yield from _freshness(section)


# ---- Rack power and running cost --------------------------------------------
def check_power_usage(section):
    watts = section["value"]
    if watts is None:
        yield _no_reading()
        return
    yield from check_levels(
        watts,
        levels_upper=POWER_UPPER,
        metric_name="Wattage",
        render_func=lambda v: "%.0f Watts" % v,
    )
    average = _average_pence_per_kwh()
    cost = round((watts / 1000.0) * 24 * 30 * average / 100.0, 2)
    yield Metric("Cost", cost, levels=COST_LEVELS)
    yield Result(
        state=State.OK,
        summary="\N{POUND SIGN}%.2f p/m (avg %.2f p/kWh: %.2f day, %.2f night)" % (
            cost, average, DAY_PENCE_PER_KWH, NIGHT_PENCE_PER_KWH),
    )
    yield from _freshness(section)


# ---- Registration -----------------------------------------------------------
for _name in ("room_temp", "room_humidity", "power_usage"):
    register.agent_section(name=_name, parse_function=parse_reading)

register.check_plugin(
    name="room_temp",
    service_name="Room Temperature",
    discovery_function=discover_reading,
    check_function=check_room_temp,
)
register.check_plugin(
    name="room_humidity",
    service_name="Room Humidity",
    discovery_function=discover_reading,
    check_function=check_room_humidity,
)
register.check_plugin(
    name="power_usage",
    service_name="Power Consumption",
    discovery_function=discover_reading,
    check_function=check_power_usage,
)
Installing it on the server
This plugin uses Check API version 1, which works on Checkmk 2.0 to 2.3 (I’m running it on 2.1.0p49). From Checkmk 2.4, plugins in this folder are no longer loaded, so on a newer version you need to port it to API version 2, which also uses a different plugin location. Checkmk’s plugin API documentation covers the migration.
As the site user on the Check_MK server:
cd ~/local/lib/check_mk/base/plugins/agent_based
cp /path/to/rack_monitor.py .            # the file is in the zip's server folder
cmk -R
Then run a dry check. It makes no changes, and any plugin error shows up here:
cmk -nv hdc-room # use your host's name in Check_MKYou should see the three services with their values. If they don’t appear, run cmk -II hdc-room to rediscover the host’s services.
Test the alerts
Don’t wait for a heatwave to find out whether the alerts work. Stop the temperature reader on the Pi and wait:
sudo systemctl stop rack-dht22After about two minutes Room Temperature goes WARN for stale data, and after five minutes CRIT, which triggers your normal notification email. Start it again with sudo systemctl start rack-dht22.
Troubleshooting
bad CRC warnings from the energenie receiver. A few of these occasionally are normal. The radio shares the 433 MHz band with lots of other devices, and the receiver rejects any packet whose checksum is wrong. What matters is whether /run/rack-monitor/energenie_... exists and has a recent timestamp.
ImportError: No module named energenie (or similar) in the receiver’s journal. The service can’t find the pyenergenie library. Check that PYENERGENIE_SRC in /etc/rack-monitor/rack-monitor.conf points to the src folder that contains the energenie directory (by default /opt/pyenergenie/src), then run sudo systemctl restart rack-energenie.
No energenie_... file, or you don’t know your sensor ID. Set RACK_LOG_LEVEL=DEBUG in /etc/rack-monitor/rack-monitor.conf, run sudo systemctl restart rack-energenie, then watch journalctl -u rack-energenie -f. Every message is logged with its sensor ID. Put that ID in ENERGENIE_SENSOR_ID, restart the service, and set the log level back to INFO.
no valid reading from DHT22 in the journal. Check the wiring and the cable length. The DHT22 can’t be read more often than every 2 seconds, which is why the reader waits 10 seconds between attempts. An occasional failure is normal and the reader retries.
The display shows --. A reading is missing or older than MAX_DATA_AGE seconds. Check the reader services are running and the files in /run/rack-monitor/ are recent.
The display uses a tiny font. No TrueType font was found. Run sudo apt install fonts-dejavu-core and restart rack-display. The service logs a warning when this happens.
Read the logs of any service:
journalctl -u rack-dht22 -u rack-energenie -u rack-display -f
What I’d do next
- Add a second DHT22 at the rack’s exhaust and alert on the difference between intake and exhaust temperature.
- Move the thresholds out of the check file and into a Check_MK GUI ruleset, so they can be changed without editing code.
Summary
For the price of a Pi that was lying around and a few cheap parts, I now get alerted by the monitoring system I already trust if the rack gets too hot or too cold, if it starts drawing too much power, or if the monitoring itself stops working. I can see my electricity cost, and the display shows the live numbers on the rack itself. The biggest lesson wasn’t in the code: put the sensor where the air you care about is, not where it’s convenient to mount.